This site uses cookies to improve your experience. To help us insure we adhere to various privacy regulations, please select your country/region of residence. If you do not select a country, we will assume you are from the United States. Select your Cookie Settings or view our Privacy Policy and Terms of Use.
Cookie Settings
Cookies and similar technologies are used on this website for proper function of the website, for tracking performance analytics and for marketing purposes. We and some of our third-party providers may use cookie data for various purposes. Please review the cookie settings below and choose your preference.
Used for the proper function of the website
Used for monitoring website traffic and interactions
Cookie Settings
Cookies and similar technologies are used on this website for proper function of the website, for tracking performance analytics and for marketing purposes. We and some of our third-party providers may use cookie data for various purposes. Please review the cookie settings below and choose your preference.
Strictly Necessary: Used for the proper function of the website
Performance/Analytics: Used for monitoring website traffic and interactions
Building a robust IT infrastructure that is easy to manage can be challenging and expensive with a legacy WAN architecture. Palo Alto Networks Prisma SD-WAN enabled SA Recycling to build robust, agile and secure networking, delivering uninterrupted connectivity while reducing trouble tickets by 97% for a digital transformation.
SD-WAN for comprehensive branch security. SD-WAN for Comprehensive Branch Security. Software-defined wide area networking (SD-WAN) has transformed the way distributed enterprises do business. Software-defined wide area networking (SD-WAN) has transformed the way distributed enterprises do business.
Traditional enterprise wide area networks, or WANs were designed primarily to connect remote branch offices directly to the data center. More importantly, WANs lack the flexibility and scalability that digital business requires. More importantly, WANs lack the flexibility and scalability that digital business requires.
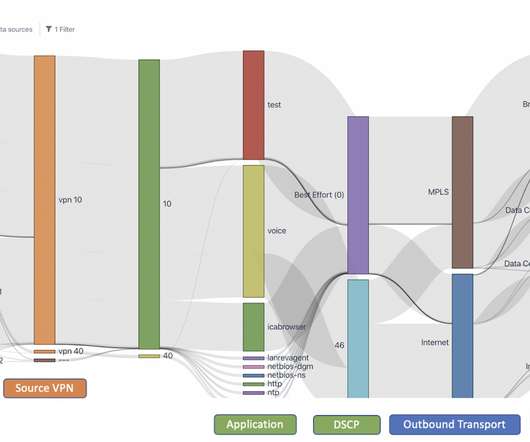
SD-WAN, one of the most disruptive network technologies of the past few years, has a fast rate of adoption. Enterprises adopting SD-WAN are driven by key factors such as WAN cost savings, application performance improvement, management and operation simplification, and more. SD-WAN Visibility from Kentik.
How to evolve your DTC startup’s data strategy and identify critical metrics. The calculation errors hard-wired into platform data can lead teams to miscalculate key metrics, “drastically overestimate their customer lifetime value, and overspend on marketing campaigns,” says Perez. Senior Editor, TechCrunch+.
That’s why today, I am extremely excited to share that we are releasing powerful new AIOps enhancements on Palo Alto Networks Prisma SD-WAN , the industry’s first next-generation SD-WAN. In this new release of Prisma SD-WAN 5.5, To learn more, join us for the “ Prisma SD-WAN AIOps Enhancements ” webcast on April 15.
We see these DevOps teams unifying logs, metrics, and traces into systems that can answer critical questions to support great operations and improved revenue flow. Traditional WAN : WAN access switches, integrated services routers, cloud access routers. Wireless access points and controller.
Enterprise WAN in 2023 Enterprise networking in 2023 is very much the same. I recently had the privilege of attending the WAN and AWS Summits in London. Not many years ago, all my WAN projects were IPsec tunnels to a headend, dual hub DMVPN designs, coordinating MPLS handoffs from last mile providers, etc. Of a flat universe.
Actionable insights into cloud network performance metrics like voice/data loss, packet loss, latency, capacity, and more. Digital transformation success depends on modern architectures like cloud, SaaS, SD-WAN, and more. In the process, your brand will take a hit and your competitive advantage won’t be an advantage for long.
Computer Vision also gives insights about customer traffic in stores, including metrics on conversion rate and sales numbers, thus helping the company decide what products to stock, how to display them, and how to arrange products across the store, Allison adds.
Traditional network monitoring relies on telemetry sources such as Simple Network Messaging Protocol (SNMP), sFlow, NetFlow, CPU, memory, and other device-specific metrics. With so many network boundaries being navigated (application, service, cloud providers, subnets, SD-WANs , etc.), What is network telemetry?
Kentik customers move workloads to (and from) multiple clouds, integrate existing hybrid applications with new cloud services, migrate to Virtual WAN to secure private network traffic, and make on-premises data and applications redundant to multiple clouds – or cloud data and applications redundant to the data center.
The problem with so much data The problem is that when you collect telemetry from today’s network, you’re collecting information from your campus, data center(s), WAN, public cloud resources, container environments, etc. It’s a tremendous amount of information and highly varied in type and format.
There are a number of definitions, but observability in the DevOps world has been about using diverse telemetry to know the internal states of systems over time (generally focused around metrics, logs, and traces), and providing answers to the unbounded questions needed to run modern applications.
KDE handles over 10B flow records/day with a microservice architecture that's optimized using metrics. And that leads us to metrics. Health checks and series metrics. Graphed, time series metrics make obvious at a glance if new code is helping. To dig deeper and get useful numbers, we need metrics reporting over time.
Consider SD-WAN as another example of DoH causing problems. The SD-WAN controller grants permission to connections based on the top-level domain (e.g., If Google has their druthers, a lot of SD-WAN vendors are going to be in a tough spot and will have to figure out another way to enforce policy. facebook.com) being visited.
There’s no better way to learn the basic skills and tools around data, analytics, and machine learning than to apply them to data that you know and that you can mine for insights to drive actions.
Additional data sources and types we’re adding include SNMP, Streaming Telemetry, MPLS labels, Cisco NBAR, VXLAN, SD-WAN performance metrics, and syslog. With a powerful backend equipped to ingest more data types than ever—and running in a highly scalable SaaS-delivered product—the Kentik team has a full pipe of planned work.
Synthetic testing is done by sending synthesized tests that are not from real users to check availability and performance metrics, such as latency, jitter and packet loss. internet, cloud, WAN, data centers, etc.) Site-to-site performance across traditional WAN and SD-WANs. What is synthetic testing? is fundamental.
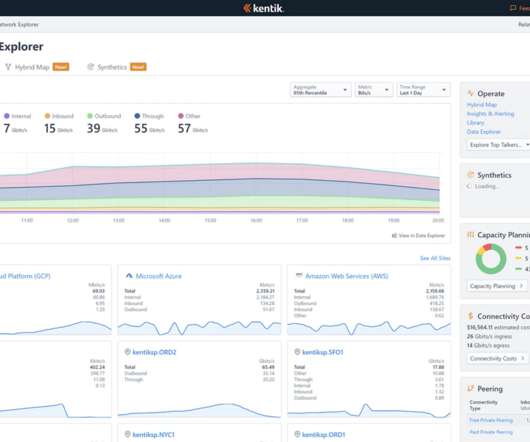
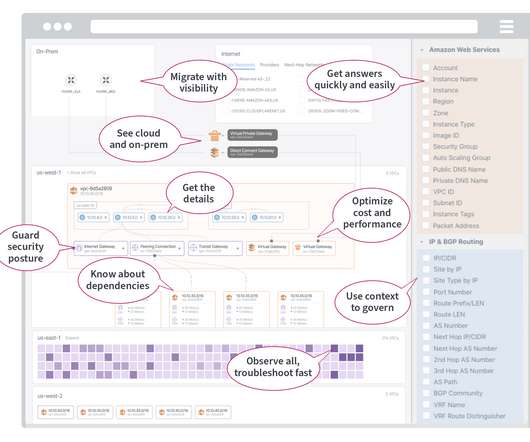
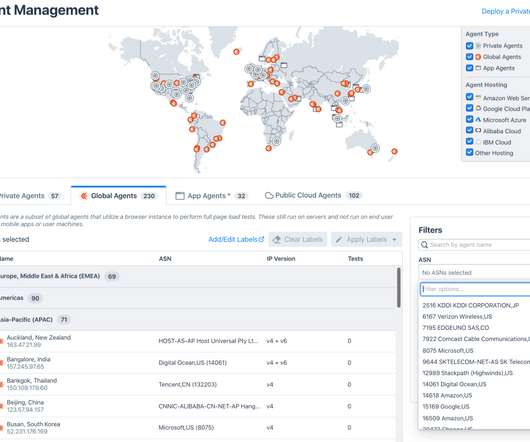
Ping and traceroute tests performed continuously with public and/or private agents generate key metrics (latency, jitter, and loss) that are evaluated for network health and performance. The Network Explorer combines flow, routing, performance, and device metrics to build the map and let you easily navigate.
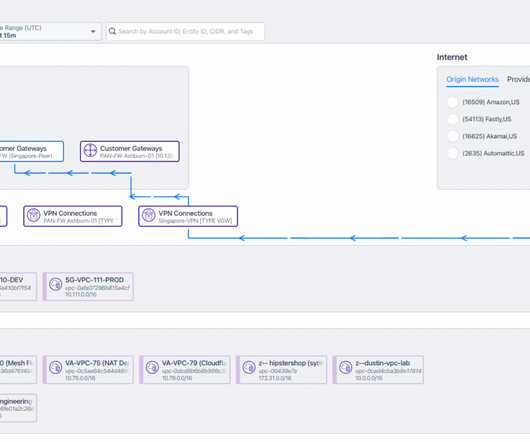
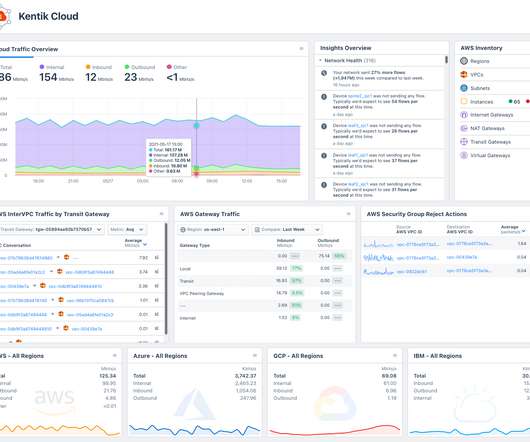
For AWS cloud networks, the Transit Gateway provides a way to route traffic to and from VPCs, regions, VPNs, Direct Connect, SD-WANs, etc. Entry point for on-premises SD-WAN connections. Cloud architects and network engineers can interact directly on the map to view hop by hop, metrics, and details on traffic, routing, and metadata.
When evaluating solutions, whether to internal problems or those of our customers, I like to keep the core metrics fairly simple: will this reduce costs, increase performance, or improve the network’s reliability? It’s often taken for granted by network specialists that there is a trade-off among these three facets.
This could mean the users are saturating the internet connectivity or that they’ve saturated the LAN (or maybe WAN). We also collect interface details and metrics using SNMP. A potential challenge with remote work here is that these users’ devices may become a bottleneck, but most often, it’s the network and not the devices.
tasks required to operate today’s complex networks, which span data center, WAN, LAN, hybrid and multi-cloud infrastructures. The four modules work across every type of network from the LAN, WAN, and traditional data center to public cloud and cloud-native environments that produce VPC flow log information.
From a high-level perspective, network operators engage in network capacity planning to understand some key network metrics: Types of network traffic. Measure and analyze traffic metrics to establish performance and capacity baselines for future bandwidth consumption. Key metrics for planning network capacity.
Only then can we pinpoint why one of our data center ToR switches is overwhelmed with unexpected traffic, why our line of business application is experiencing latency over the SD-WAN, why an OSPF adjacency is flapping, or why our SaaS app performance is terrible despite having a ton of available bandwidth.
Observability strategies like collecting, sampling, and analyzing MELT (metrics, events, logs, and traces) telemetry have dramatically improved structural responses to challenges like incident response and system-wide optimizations. DevOps and NetOps need to work together Collaboration is often a two-way street.
measuring metrics associated with that “test” and then building KPIs using those metrics. Another use case for baselining performance could be for comparing network performance in evaluating different SD-WAN solutions. Synthetic monitoring achieves this by generating different types of traffic (e.g.,
Monitoring needs to span multiple domains: the private enterprise data center and WAN; fixed and mobile service provider networks; the public Internet; and hybrid multi-cloud infrastructure. Performance metrics and other types of monitoring data can be collected in real time using streaming telemetry protocols such as gRPC.
From a high-level perspective, network operators engage in network capacity planning to understand some key network metrics: Types of network traffic. Measure and analyze traffic metrics to establish performance and capacity baselines. Key Metrics. Capacity of current network infrastructure.
One of the more obvious, yet powerful uses for Kentik Detect is a dashboard that provides a comprehensive overview of network traffic across the entire infrastructure: LAN / WAN, internal data centers and public cloud. This first panel shows traffic per location across their WAN: banking branches, ATMs, HQ buildings, trading desks, etc.
SD-WAN and More. The award is based on six criteria: reduction of cyber risk, key performance metrics, viability, efficiency, flexibility and differentiation. John Kindervag, creator of Zero Trust and field CTA at Palo Alto Networks, explained in a recent webinar , “There are no Zero Trust products. Cybersecurity Innovations.
Using a synthetic test, we can capture the metrics for each component of that interaction from layer 3 to the application layer itself. This isn’t necessarily a bad thing, but it isn’t the same as collecting metrics on the application’s activity itself. Synthetic tests can be very advanced in what they monitor.
Until just a few years ago, enterprise networks were predominantly comprised solely of one or more private data centers connected to a series of campuses and branch offices by a private WAN that was based on MPLS VPN technology from a major telecom carrier. But cloud realities break that assumption. routers and switches).
Monitoring products consume flows, events, logs, metrics, packets, configurations, transaction details, and many other data resources, in different combinations, with varying degrees of success at achieving traffic-centric observability. Supported data sources, therefore, are key to understanding each vendor’s focus and capabilities.
With an infrastructure that’s pervasively instrumented for actual network performance metrics, the above issues disappear. Or perhaps you have an application in a traditional datacenter delivered to internal users over a WAN. bps or pps) but also on the performance metrics provided by kprobe.
So NPM is about another set of metrics. Metrics such as round-trip time, out-of-order packets, retransmits, and fragments, tell you how well the network is doing its job. And this makes it hard to know if you have the metrics and measurements that you need. NPM Architectures. Three NPM challenges.
Addressing the visibility gaps left by legacy appliances in centralized data centers, Kentik NPM uses lightweight software agents to gather performance metrics from real traffic wherever application servers are distributed across the Internet. Is it the WAN? Is it the network? Is it the Internet? Is it the data center?
The SD-WAN systems, the DDoS scrubbers, and the intrusion detection appliances. Built primarily as simple metrics warehouses, most “legacy” network monitoring vendors modified their platforms to support the cloud by simply ingesting a few cloud metrics from services like AWS CloudWatch or adding support for simple, unenriched VPC flow logs.
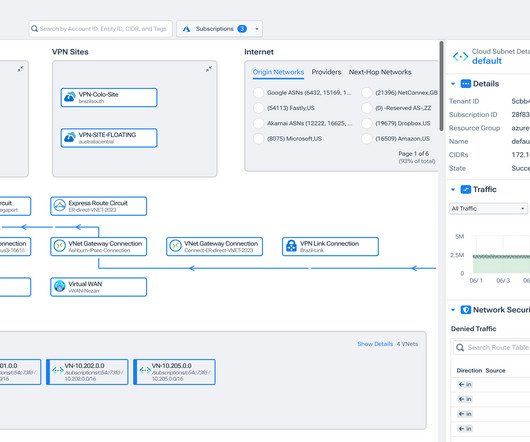
For example, there are central log analytics workspaces for all central log metrics and (audit) or resources. Here is where we find the Virtual WAN and all the Virtual Hubs, as well as the firewalls connected to those hubs and, of course, the express route circuits and Peer to Site and Site to Site Gateways.
Distributors of the Year TD SYNNEX & Westcon TD SYNNEX is named the Global and North America Distributor of the Year, a testament to their exceptional performance across all key metrics, including remarkable pipeline growth and consistent success.
We organize all of the trending information in your field so you don't have to. Join 49,000+ users and stay up to date on the latest articles your peers are reading.
You know about us, now we want to get to know you!
Let's personalize your content
Let's get even more personalized
We recognize your account from another site in our network, please click 'Send Email' below to continue with verifying your account and setting a password.


Let's personalize your content