This site uses cookies to improve your experience. To help us insure we adhere to various privacy regulations, please select your country/region of residence. If you do not select a country, we will assume you are from the United States. Select your Cookie Settings or view our Privacy Policy and Terms of Use.
Cookie Settings
Cookies and similar technologies are used on this website for proper function of the website, for tracking performance analytics and for marketing purposes. We and some of our third-party providers may use cookie data for various purposes. Please review the cookie settings below and choose your preference.
Used for the proper function of the website
Used for monitoring website traffic and interactions
Cookie Settings
Cookies and similar technologies are used on this website for proper function of the website, for tracking performance analytics and for marketing purposes. We and some of our third-party providers may use cookie data for various purposes. Please review the cookie settings below and choose your preference.
Strictly Necessary: Used for the proper function of the website
Performance/Analytics: Used for monitoring website traffic and interactions
phenomenon We’ve all heard the slogan, “metrics, logs, and traces are the three pillars of observability.” You probably use some subset (or superset) of tools including APM, RUM, unstructured logs, structured logs, infra metrics, tracing tools, profiling tools, product analytics, marketing analytics, dashboards, SLO tools, and more.
At Imperva, we took advantage of Kafka Streams to build shared state microservices that serve as fault-tolerant, highly available single sources of truth about the state of objects in our system. At the core of each shared state microservice we built was a Kafka Streams instance with a rather simple processing topology.
Observability has three pillars: metrics, logs, and traces.” But logs are expensive and everybody wants dashboards… so we buy a metrics tool. Softwareengineers want to instrument their applications… so we buy an APM tool. The front-end engineers point out that they need sessions and browser data… so we buy a RUM tool.
The interplay of distributed architectures, microservices, cloud-native environments, and massive data flows requires an increasingly critical approach : observability. Observability is not just a buzzword; it’s a fundamental shift in how we perceive and manage the health, performance, and behavior of software systems.
At Serverless Computing London keynote, Charity explained what we mean when we say observability, what it means to have an observable system, how it connects to old methods of monitoring or debugging, and why the modern serverless softwareengineer should give a flying crap. Metrics, logging, monitoring, and reliability.
By Ammar Khaku Introduction In a microservice architecture such as Netflix’s, propagating datasets from a single source to multiple downstream destinations can be challenging. Today these metrics are used by the Gutenberg team to monitor our publish-propagation SLI and to alert in the event of widespread issues. we’re hiring !
The quality of collaboration in software development is measured by a direct line of sight into the customer experience. DevOps is a given in today’s softwareengineering world. Especially in a SaaS business, metrics aggregated over time matter most. Read more about this in my prior post. and that’s ok.
A Brave New (Generative) World – The future of generative softwareengineering Keith Glendon 26 Mar 2024 Facebook Twitter Linkedin Disclaimer : This blog article explores potential futures in softwareengineering based on current advancements in generative AI.
The project involved decommissioning an extensive monolith Scala application into smaller microservices. The team used the Strangler Fig pattern to decommission the legacy system gradually in new Scala and modern microservices running in Kubernetes. We’ll put the focus on Kubernetes and the Java Virtual Machine ( JVM ).
Niosha Behnam | Demand Engineering @ Netflix At Netflix we prioritize innovation and velocity in pursuit of the best experience for our 150+ million global customers. In the event of an isolated failure we first pre-scale microservices in the healthy regions after which we can shift traffic away from the failing one.
He is a softwareengineer, consultant, and author of “Continuous Delivery”, “Modern SoftwareEngineering,” “CD Pipelines,” and “ Software Architecture Metrics. “ Farley is synonymous with being at the forefront of modern software development practices.
You can derive metrics, logs and traces from arbitrarily-wide structured events (which o11y is defined by). You can still get insight into the internal state of systems from their external data even if those are just metrics or logs. A closely related view is that observability has three pillars: metrics, logs and traces.
In the words of Ben Treynor Sloss, Google’s VP of engineering who coined the very term SRE , “it’s what happens when you ask a softwareengineer to design an operation function.”. Metrics are crucial. Treat operations as a software problem. SRE utilizes softwareengineering to solve operations problems.
This platform provides a set of technologies to build, deploy, run, and manage applications developed by composing together components (micro frontends, microservices, UI/UX elements, etc.) The Performance API is a set of standards that measure and analyze various performance metrics. and business capabilities. Conclusion.
In fact, we have found that almost without exception, softwareengineers love to work in a Continuous Delivery environment because of the challenge, the discipline, the clarity, and the immediate feedback. If you visit Silicon Valley these days you will find that software developers have been replaced by softwareengineers.
“Observability” and “monitoring” are two words that can perplex even experienced softwareengineers. New developers coming into a softwareengineering or operations role can find it challenging to understand the difference between observability and monitoring. As software has evolved, so has observability.
In the past five years, we’ve seen a drastic increase in adoption by engineering teams of all sizes. The promise of standardization of deployments and scaling across different types of applications, from static websites to full-blown microservice solutions, has fueled this sharp increase.
And, if you’re lucky: How does each piece of software and infrastructure fit together to serve each customer? APM brings this level of metric rigor to applications, recording uptime, requests received, statuses returned, latency, and resource usage for each running process. Time-series metrics become very expensive. What is APM?
Virtually all modern software and applications built today are distributed systems of some sort, says Sam Newman , director at Sam Newman & Associates and author of Building Microservices. Even for limited, node-level metrics, traditional monitoring systems do not scale well on large clusters of hundreds to thousands of nodes.
He describes “some surprising theories about softwareengineering”: I discuss these theories in terms of two fundamentally different development styles, the "cathedral" model of most of the commercial world versus the "bazaar" model of the Linux world. If you give softwareengineers manual work, their first instinct is to automate it.
This edition is still in the making and you can still submit your CFP, we are preparing our Talk about Christian Ciceri’s chapter of the book “ Software Architecture Metrics ”: Private Builds and Metrics: Tools for Surviving DevOps Transitions. Hopefully, it will get accepted and we will see each other there!
But there’s an outlier here: softwareengineering. Despite softwareengineering being one of the fastest-growing professions—development platform GitHub is adding more than 10 million developers a year, with 56 million total developers now on that platform–software delivery is still more of an art than a science.
Recently, Michael Shklyar, a DevOps SoftwareEngineer from the Exadel Digital Transformation Practice, recently sat down with Alexey Korzhov , a DevOps specialist from one of our client projects, to discuss Consul, it’s advantages, and how it helps him solve issues. We can even choose metrics for monitoring containers. .
In this blog, we unpack how observability fits into the landscape of other modern practices, such as the DevOps, SRE (Site Reliability Engineering), and cloud-native movements. This session also addresses example technologies used to build cloud-native apps, such as containers, service meshes, microservices, and immutable infrastructure.
At Serverless Computing London keynote, Charity explained what we mean when we say observability, what it means to have an observable system, how it connects to old methods of monitoring or debugging, and why the modern serverless softwareengineer should give a flying crap. Metrics, logging, monitoring, and reliability.
Matt Duftler, Senior SoftwareEngineer at Google, and Michael Graff, Senior SoftwareEngineer at Netflix, gave a talk about automated canary deployments. “So And it supports like an extensible set of metric services and judges and cloud platforms and everything else. So what’s canary deployment?
Use a microservices approach to isolate other components from these less mature frameworks. Observability Besides the resource metrics you typically collect, like CPU and RAM utilization, you need to closely monitor GPU utilization if you host a model on Amazon SageMaker or Amazon Elastic Compute Cloud (Amazon EC2).
With the prevalence of microservices, it’s easy to work under the assumption that the systems we observe are distributed. A customer can also make assumptions about Honeycomb or the Customer Success team, such as: Observability is only for softwareengineering and development.
About Software Architecture Metrics book. This edition is focused on software architecture metrics as they are key to the maintainability and architectural quality of a software project. Sonya Natanzon is an engineering leader and software architect with many years of experience.
The LLM proxy (a microservice deployed on an EKS pod as part of the Service VPC) simplifies the integration of LLMs for Webex teams, providing a streamlined interface and reducing operational overhead. Ravi’s expertise includes microservices, containerization, AI/ML, and generative AI.
This year the event was focused on Software Architecture Metrics as they are key to the maintainability and architectural quality of a software project. He has been in the software industry since 1983 and has significant experience and expertise in application, integration, and enterprise architecture.
Software Development Experts Interviews Inma Navas Our first interview of “Talks with Software Development Experts,” was with Inma Navas, a softwareengineer and the winner of our Software Architecture Metrics book giveaway. Her current stack is Java and Kotlin.
Someone once described dashboards to me as “expensive TV for softwareengineers.” Dashboards then become formulaic reflections of these preformed notions: performance is defined by nines rather than by user experience, latency in parts of the application hides behind unintuitive metrics like p90, and error rates become noise.
Someone once described dashboards to me as “expensive TV for softwareengineers.” Dashboards then become formulaic reflections of these preformed notions: performance is defined by nines rather than by user experience, latency in parts of the application hides behind unintuitive metrics like p90, and error rates become noise.
Consider building a metrics and alerting pipeline in which events are bucketed into two-minute windows. Each time the graph refreshes, it will get the most recent metric values in each window. This essentially corresponds to line 1 of Metrics App with Alerts. We window the incoming events in line 3 of Metrics App with Alerts.
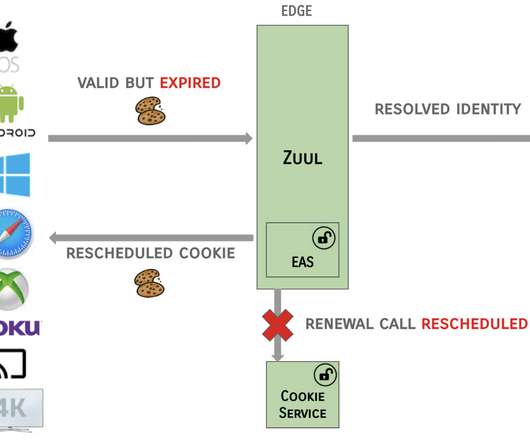
By offloading token processing from these systems to the central Edge Authentication Services, downstream systems saw significant gains in CPU, request latency, and garbage collection metrics, all of which help reduce cluster footprint and cloud costs. And, we’re hiring Senior SoftwareEngineers !
Clojure remains our language of choice, but as we continue to pull microservices from our monolith (over a dozen at this point), we are committed to using the right set of tools for the job and we evaluate that decision for each new service. Go is also used for CLI tools. The frontend. Come work with us and help us ship our own code faster!
The widespread adoption of containers, microservices and orchestration have made it easier than ever to take a small bit of software and push it live in front of users — and, in doing so, push a whole bunch of comfortable tasks (debugging, profiling) into uncomfortable territory: production.
This talk was inspired by an article Michael wrote in 2018, Hypothesis Driven Development for SoftwareEngineers. We log absolutely everything we possibly can, all of the metrics, the exceptions, et cetera. So the load testing one here, one of our new microservices makes a number of calls to get content. TRANSCRIPT.
We contribute a lot to the software development and software architecture communities, and we have identified like-minded companies that focus on working software, deliver great results, and care about community and knowledge sharing. They are a reference in the software development industry.
This is a guest post from Salih Kardan, SoftwareEngineer @Thundra and Committer at Apache, formerly SRE @Opsgenie. Thundra collects and correlates all your metrics, logs, and traces, allowing you to quickly identify problematic invocations and also analyzes external services associated with that function.
Scaling With Developer Experience Developers in the Netflix streaming world compose the customer-facing Netflix experience out of hundreds of microservices, reachable by complex routing rules. On the Netflix Studio side, in Content Engineering, each team develops distinct products with simpler routing needs.
I designed these tutorials to introduce you to k6 and to show you how to use k6 for performance testing of microservices. In the tutorial for performance testing with k6, I covered how to output k6 metrics and logs to the cloud for analysis and visibility by your whole team. You are ready to start learning! Conclusion.
Introduction Over the past decade, DevOps has had a transformative impact on how companies manage their softwareengineering efforts. Continuous testing integrates automated test execution into the software delivery pipeline, enabling faster feedback on software quality.
We organize all of the trending information in your field so you don't have to. Join 49,000+ users and stay up to date on the latest articles your peers are reading.
You know about us, now we want to get to know you!
Let's personalize your content
Let's get even more personalized
We recognize your account from another site in our network, please click 'Send Email' below to continue with verifying your account and setting a password.


Let's personalize your content