This site uses cookies to improve your experience. To help us insure we adhere to various privacy regulations, please select your country/region of residence. If you do not select a country, we will assume you are from the United States. Select your Cookie Settings or view our Privacy Policy and Terms of Use.
Cookie Settings
Cookies and similar technologies are used on this website for proper function of the website, for tracking performance analytics and for marketing purposes. We and some of our third-party providers may use cookie data for various purposes. Please review the cookie settings below and choose your preference.
Used for the proper function of the website
Used for monitoring website traffic and interactions
Cookie Settings
Cookies and similar technologies are used on this website for proper function of the website, for tracking performance analytics and for marketing purposes. We and some of our third-party providers may use cookie data for various purposes. Please review the cookie settings below and choose your preference.
Strictly Necessary: Used for the proper function of the website
Performance/Analytics: Used for monitoring website traffic and interactions
A new company from the creators of the Godot game engine is setting out to grab a piece of the $200 billion global video game market — and to do so, it’s taking a cue from commercial opensource software giant Red Hat. ” The opensource factor. . ” The opensource factor.
Containerized microservices enable developers and DevOps engineers to meet these demands. Microservices are simple to develop, test, deploy, and scale, but they’re not without their own challenges. Each microservice must be individually configured, deployed, and monitored. What is Kubernetes?
phenomenon We’ve all heard the slogan, “metrics, logs, and traces are the three pillars of observability.” You probably use some subset (or superset) of tools including APM, RUM, unstructured logs, structured logs, infra metrics, tracing tools, profiling tools, product analytics, marketing analytics, dashboards, SLO tools, and more.
If you think of the shift to microservices and containers as an evolution rather than a revolution then you’ve reached the right place! Challenges such as: Managing the transition from a monolithic application to microservices. Dealing with polyglot programming across microservices. Logging across microservices.
Below we outline common approaches to distributed tracing, the challenges these methods pose and how OverOps can help deliver greater insights when troubleshooting across microservices. The accelerated adoption of microservices and increasingly distributed systems brings the promise of greater speed, scalability and flexibility.
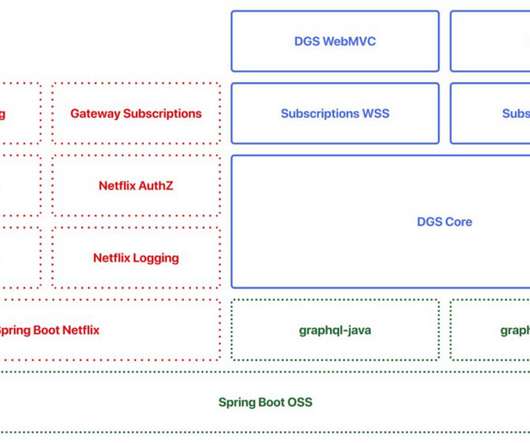
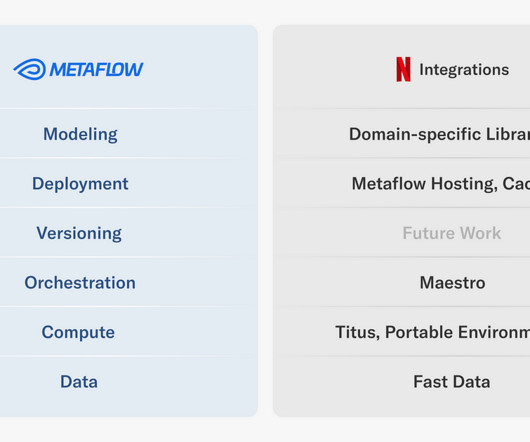
By Paul Bakker and Kavitha Srinivasan , Images by David Simmer , Edited by Greg Burrell Netflix has developed a Domain Graph Service (DGS) framework and it is now opensource. This framework was initially intended to be internal only, focusing on integration with the Netflix ecosystem for tracing, logging, metrics, etc.
Here we present a list of 10 open-source Kubernetes tools to make your SRE and Ops teams more effective to achieve their service level objectives. Sysdig Inspect helps you understand trends, correlate metrics and find the needle in the haystack. Kube-ops-view. With Stern, the result is color-coded for quicker debugging.
Their focus was to build a solution that makes it easier for development teams to build Microservice architecture-based applications and deploy those to Azure. What are the features that development teams want when building and hosting microservices? Microservices using Dapr in Azure Container Apps.
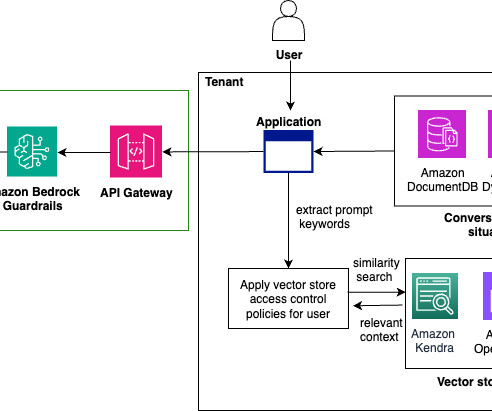
Each component in the previous diagram can be implemented as a microservice and is multi-tenant in nature, meaning it stores details related to each tenant, uniquely represented by a tenant_id. This in itself is a microservice, inspired the Orchestrator Saga pattern in microservices.
The underlying large-scale metrics storage technology they built was eventually opensourced as M3. “Sitting at the intersection of the major trends transforming infrastructure software – the rise of open-source and the shift to containers – Chronosphere has quickly become a transformative player in observability.
Microservices architecture has become popular over the last several years. Many organizations have seen significant improvements in critical metrics such as time to market, quality, and productivity as a result of implementing microservices. Recently, however, there has been a noticeable backlash against microservices.
The cloud-native market has seen the introduction of a range of opensource DevOps tools — tools that combine software development and IT operations — built to address very specific use cases. Investors are keen on Devtron, as evidenced by the company today closing a $12 million funding round led by Insight Partners.
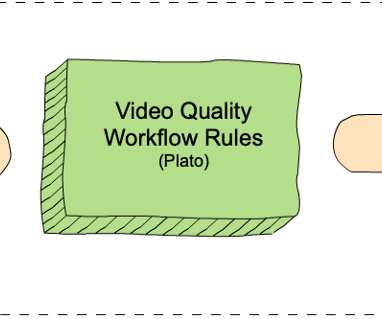
In particular, the VMAF metric lies at the core of improving the Netflix member’s streaming video quality. It has become a de facto standard for perceptual quality measurements within Netflix and, thanks to its open-source nature , throughout the video industry. We call this system Cosmos. VMAF and SSIM ).
If you want to develop microservices or backend applications in Java and make use of innovative and new technologies while also reducing coding effort, speeding development time, and producing a more resilient application, you should consider using Jakarta EE and MicroProfile. MicroProfile optimizes Enterprise Java for microservices. .
Underlying technology of Chaos Studio for Azure Kubernetes Service is the openssource platform Chaos Mesh We started with deploying a microservice application on to AKS. When you inject chaos in to your infrastructure, you quickly come to realize that you need metrics. Without metrics, you are blind.
Observability has three pillars: metrics, logs, and traces.” But logs are expensive and everybody wants dashboards… so we buy a metrics tool. We start unbundling the monolith into microservices, and pretty soon we can’t understand anything without traces… so we buy a tracing tool. Logs, metrics, traces, APM, RUM.
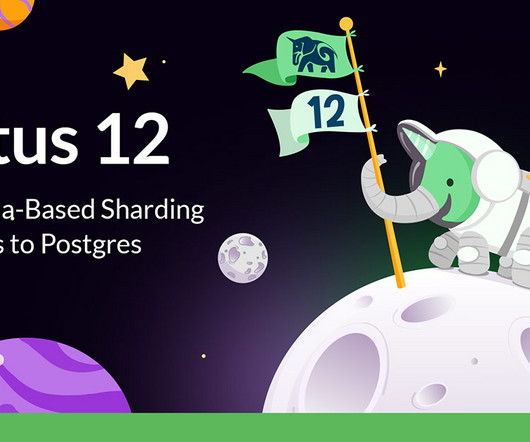
Our latest Citus opensource release, Citus 12, adds a new and easy way to transparently scale your Postgres database: Schema-based sharding, where the database is transparently sharded by schema name. Each microservice has its own state, which is usually quite small, and simple.
Service mesh emerged as a response to the growing popularity of cloud-native environments, microservices architecture, and Kubernetes. While Kubernetes helped resolve deployment challenges, the communication between microservices remained a source of unreliability. were not optimized.
In a microservice architecture , dozens of containers will be interconnected making up the app. As all the tools mentioned above, Ansible is open-source, and has a range of tools for DevOps. The opensource version of the SaltStack is free to use. Also deploying the open-source code is free in Travis CI.
Distributed Tracing: the missing context in troubleshooting services at scale Prior to Edgar, our engineers had to sift through a mountain of metadata and logs pulled from various Netflix microservices in order to understand a specific streaming failure experienced by any of our members. Trace Instrumentation: how will it impact our service?
Why do companies use microservices with DevOps/cloud solutions, and what are the advantages and possible pitfalls of microservices integration? Microservices in a Nutshell. The sole build pipeline creates a bottleneck for releasing too big and too complex products, and here’s where microservices come into play.
We use and contribute to many open-source Python packages, some of which are mentioned below. One example is the Spectator Python client library, a library for instrumenting code to record dimensional time series metrics. Finally, it’s been our team’s commitment to contribute to papermill and scrapbook opensource projects.
We are thrilled to announce the general availability of the Cloudera AI Inference service, powered by NVIDIA NIM microservices , part of the NVIDIA AI Enterprise platform, to accelerate generative AI deployments for enterprises. This service supports a range of optimized AI models, enabling seamless and scalable AI inference.
He is a software engineer, consultant, and author of “Continuous Delivery”, “Modern Software Engineering,” “CD Pipelines,” and “ Software Architecture Metrics. He is a prominent figure in the world of software development and open-source advocacy.
You’ll also be introduced to nine open-source tools you can use to automate and streamline your incident response processes. The following are popular, free, open-source tools you can use to automate or streamline your incident response process. In this article, you’ll learn what incident response is. GRR Rapid Response.
For general GraphQL questions, we lean on the opensource community plus cultivate an internal GraphQL community to discuss hot topics like pagination, error handling, nullability, and naming conventions. The DGS framework is planned to be open-sourced in early 2021. We prioritized three areas: Alerting ?—?report
Decompose these into quantifiable KPIs to direct the project, utilizing metrics like migration duration, savings on costs, and enhancements in performance. Think about refactoring to microservices or containerizing whenever feasible, to enhance performance in the cloud setting. lowering costs, enhancing scalability). How to prevent it?
A metric crossed a threshold. Metrics are a key part of understanding application health. But sometimes you can have too many metrics, too many graphs, and too many dashboards. An application lives in an ecosystem The Application Health Model A microservice doesn’t live in isolation. Client metrics and QoE changes.
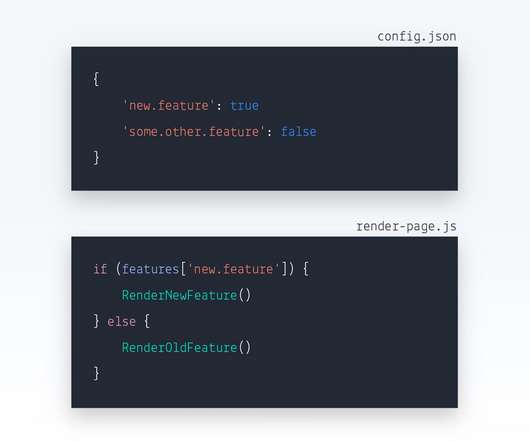
Test new microservices or third-party tags in production for interoperability testing. Experiments provide concrete reporting and measurements to ensure that you are launching the best version of a feature that positively impacts company metrics. You may opt to deploy using an open-source solution.
She then explained their product called “ Entando ” which is an open-source application composition platform for building enterprise web apps on Kubernetes. Udupi explained some of the data returned from the Performance API to measure the performance metrics of our pages and gave some suggestions on how to optimize these metrics.
And Holochain is a decentralized framework for building peer-to-peer microservices–no cloud provider needed. It is not opensource, and is now entering private beta. Holochain is a framework for building peer-to-peer microservices without a centralized server. Dynaboard is a web development tool designed for remote work.
As many of you likely know, Citus is an opensource PostgreSQL extension that turns Postgres into a distributed database. My Microsoft colleague Melanie Plageman added a new view called pg_stat_io to PostgreSQL 16, which shows essential I/O metrics for in-depth examination of I/O access patterns. Figure 1: As of Citus 12.0,
As the complexity of microservice applications continues to grow, it’s becoming extremely difficult to track and manage interactions between services. Cilium (OpenSource) - provide secure network connectivity between application containers. Contiv (OpenSource) - provides configurable networking (e.g.
The Machine Learning Platform (MLP) team at Netflix provides an entire ecosystem of tools around Metaflow , an opensource machine learning infrastructure framework we started, to empower data scientists and machine learning practitioners to build and manage a variety of ML systems.
Consul is quite flexible and the monitoring system has numerous metrics. We can even choose metrics for monitoring containers. . The main benefit of Consul, as opposed to microservices architecture, is that microservices architecture is quite complex. This Consul solution capability is named Service Mesh.
Out of a shared frustration with the state of proprietary telemetry affairs, standards began to emerge in the form of two parallel opensource projects: OpenCensus and OpenTracing. OpenTelemetry provides an open standard for generating, collecting and exporting application telemetry across any number of backend systems.
APM brings this level of metric rigor to applications, recording uptime, requests received, statuses returned, latency, and resource usage for each running process. Typically, APM includes performance metrics, error detection, and—this is the ‘if you’re lucky’ part—distributed traces. Time-series metrics become very expensive.
Rapidly evolving frameworks – Opensource frameworks like LangChain are evolving rapidly. Use a microservices approach to isolate other components from these less mature frameworks. Follow the normal practice of least-privilege access, for example restricting incoming prompts from other systems.
A feature store may also have a dedicated microservice to preprocess data automatically. Monitoring tools are often constructed of data visualization libraries that provide clear visual metrics of performance. Source: retentionscience.com. There are some ground-works and open-source projects that can show what these tools are.
From a DX standpoint, this is amazing: we can almost always find an opensource solution to problems that aren’t ultra-specific to the project we’re working on. This is the process of breaking down abstract concepts like “feels fast” into concrete metrics: how can we measure that a UX goal has been met?
The open-source data era kicked off with Hadoop and MapReduce in the early noughties, soon followed by Kafka and Spark. In 2018, Google open-sourced another of their machine learning projects: Kubeflow, the machine learning toolkit for Kubernetes. The road to end-to-end machine learning platforms.
In this blog post, we are thrilled to share that we are open-sourcing one such tool: the Netflix Data Explorer. See our integration with Metrics later in this article.) If instead, you have a REST-based microservice that provides this information, then you can choose “custom” and write a few lines of code necessary to fetch it.
Then we rebuilt the thing, made it open, extensible, support some advanced use cases that neither of our internal system supported in the past. Did all this out in the open in opensource. And it supports like an extensible set of metric services and judges and cloud platforms and everything else.
Learnings from stories of building the Envoy Proxy The concept of a “ service mesh ” is getting a lot of traction within the microservice and container ecosystems. particularly within an API gateway like the opensource Kubernetes-native Ambassador gateway. From Monolith to Service Mesh, via a Front Proxy?—?Learnings
We organize all of the trending information in your field so you don't have to. Join 49,000+ users and stay up to date on the latest articles your peers are reading.
You know about us, now we want to get to know you!
Let's personalize your content
Let's get even more personalized
We recognize your account from another site in our network, please click 'Send Email' below to continue with verifying your account and setting a password.


Let's personalize your content