
How To Fix Network Load Balancer Health Check On Secondary Network Interface
Xebia
JANUARY 29, 2024
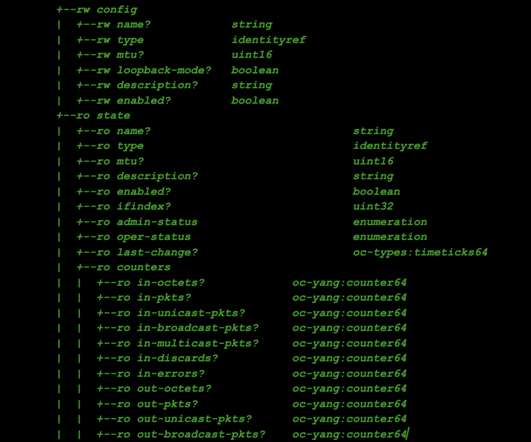
Did you configure a network load balancer for your secondary network interfaces ? How Passthrough Network Load Balancers Work A passthrough Network Load Balancer routes connections directly from clients to the healthy backends, without any interruption. metric 100. metric 100. local 10.0.1.2


Let's personalize your content