This site uses cookies to improve your experience. To help us insure we adhere to various privacy regulations, please select your country/region of residence. If you do not select a country, we will assume you are from the United States. Select your Cookie Settings or view our Privacy Policy and Terms of Use.
Cookie Settings
Cookies and similar technologies are used on this website for proper function of the website, for tracking performance analytics and for marketing purposes. We and some of our third-party providers may use cookie data for various purposes. Please review the cookie settings below and choose your preference.
Used for the proper function of the website
Used for monitoring website traffic and interactions
Cookie Settings
Cookies and similar technologies are used on this website for proper function of the website, for tracking performance analytics and for marketing purposes. We and some of our third-party providers may use cookie data for various purposes. Please review the cookie settings below and choose your preference.
Strictly Necessary: Used for the proper function of the website
Performance/Analytics: Used for monitoring website traffic and interactions
Porting a software project to a new operating system is always interesting and fun, and Alpine Linux with its musl libc brings a unique set of challenges. A while ago, I was tasked with porting OverOps’ native agent to Alpine Linux. LLDB on Alpine Linux. Even getting GDB up and running proved to be a major challenge!
Environmental oversight : FinOps focuses almost exclusively on financial metrics, sidelining environmental considerations, which are becoming increasingly critical for modern organizations. GreenOps incorporates financial, environmental and operational metrics, ensuring a balanced strategy that aligns with broader organizational goals.
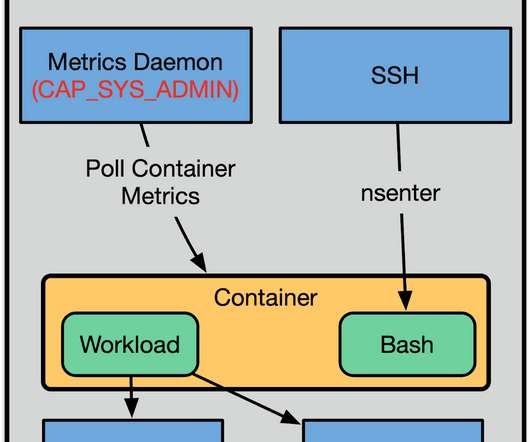
The building blocks of multi-tenancy are Linux namespaces , the very technology that makes LXC, Docker, and other kinds of containers possible. This is important because, in Linux, UID 0 (or root’s privileges), do not come from the mere fact that the user is root, but from capabilities. making it so that users cannot use “root.”
By adding free cloud training to our Community Membership, students have the opportunity to develop their Linux and Cloud skills further. Each month we will kick off our community content with a live study group allowing members of the Linux Academy community to come together and share their insights in order to learn from one another.
At Red Hat Summit 2024 in Denver today, the company announced plans to extend its Red Hat Lightspeed generative AI capabilities across all its platforms, including Red Hat OpenShift and Red Hat Enterprise Linux (RHEL). Data Center Automation, Generative AI, IT Skills, Linux, Red Hat Administrative dashboard.
Today, Godot claims some 1,500 contributors, and is considered one of the world’s top open source projects by various metrics. In truth, Godot is nowhere near having the kind of impact in gaming that Linux has had in the enterprise, but it’s still early days — and this is exactly where W4 could make a difference.
It is commonly available in various Linux distributions. “Top” is a robust, lightweight command-line tool that provides real-time reports on system-wide resource utilization. However, we have observed that it may not accurately report information when executed within a Docker container. This post aims to bring this issue to your attention.
Identifying the greatest weaknesses in cybersecurity strategies is rarely easy due to issues like a lack of comprehensive tracking of cybersecurity metrics and an inability to determine how spending on different areas impacts outcomes. He is also a longtime Linux geek, and he has held roles in Linux system administration.
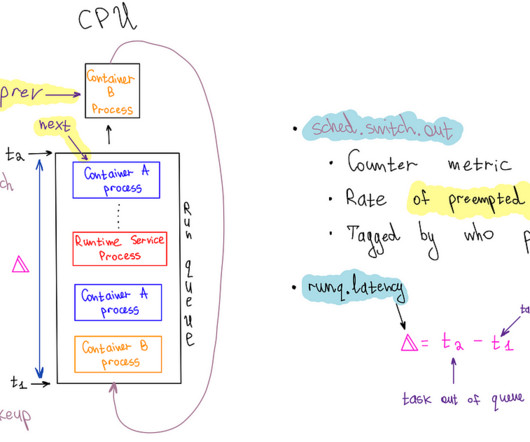
In this blog post, we'll reveal how we leveraged eBPF to achieve continuous, low-overhead instrumentation of the Linux scheduler, enabling effective self-serve monitoring of noisy neighbor issues. Learn how Linux kernel instrumentation can improve your infrastructure observability with deeper insights and enhanced monitoring.
If you’re already a student of Linux Academy’s, log in here to follow along, or you can sign up for a FREE 7-day trial to get started. Linux Academy cloud servers are the best way to build your cluster because if you mess up, it’s easy to delete the server and re-create it in a matter of minutes. sudo apt-get update.
To see a company riding all these market tailwinds with fundamentals and metrics like this is really, really unusual. It has also launched a Linux Desktop Application and integrations with Slack and Rippling. . Our hope is this [latest round] allows the entire company to be even more aggressive about winning this market.”.
Pennarun says that, even if a company uses Tailscale to route public-facing browser traffic through nodes like Linux, Windows, macOS, and Android TV devices, only these devices see decrypted traffic or have any view into what traffic they’re sent. ” Tailscale isn’t revealing revenue numbers today. .
By adding free cloud training to our Community Membership, students can develop their Linux and Cloud skills even further. Members of the Linux Academy community come together and share their insights and questions. Stay tuned to the Linux Academy blog for details! Linux Academy Free Courses in July. Database Essentials.
KEDA (Kubernetes Event-Driven Autoscaling) is an open-source project that brings event-driven capabilities to Kubernetes, enabling applications to scale dynamically based on events, rather than just traditional CPU or memory metrics. KEDA operates by monitoring external event sources and metrics, which are defined through triggers.
A long time ago, in a galaxy far, far away, I said a lot of inflammatory things about metrics. Metrics are s**t salad.”. Metrics are simply nerfed dimensions.”. Metrics suck ,” “metrics are legacy ,” “metrics and time series aggregates will f **g kneecap you.”. Metrics aren’t worthless; they’re just limited.
This announcement will be incredibly useful for both Linux Academy and our Learners—providing access to in-depth articles created by Architects, Engineers, and Leaders from inside AWS. Please reach out to us on the Linux Academy Community slack with: . What Linux Academy can do to better serve you.
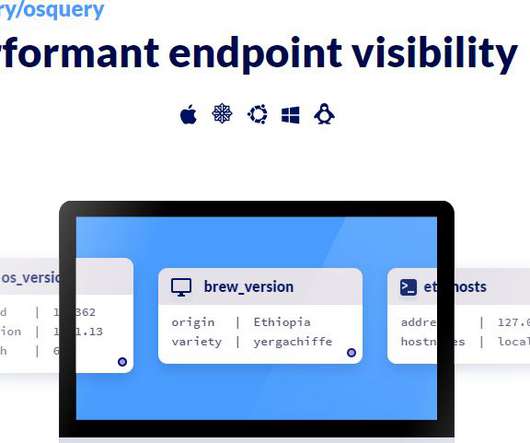
You can use Wazuh in a Docker container or on Linux, Windows, and macOS systems. You can use GRR in a Docker container or on standard Linux systems. You can use Osquery on Windows, Linux, and macOS machines. Recently turned over to The Linux Foundation to ensure continued support. GRR is composed of a client and a server.
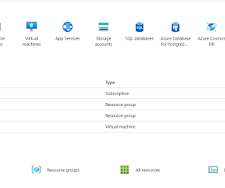
OS guest diagnostics – You can turn this on to get the metrics per minute. Diagnostics storage account – It is a storage account where your metrics will be written so we can also analyze them with other tools if we want. It helps to solve the startup issues. For more – [link].
Image generated via ChatGPT 4o / DALL-E by Nick Miles Technical details While investigating a security flaw in a cloud service (details of which are still pending public disclosure), Tenable researchers discovered that they were able to access a variety of metrics and logging endpoints internal to the cloud service itself.
We started investigating how to produce metrics for each of the three phases: download, extract, and create. After much contemplation of the message stream, we discovered that by aggregating the time and data transferred across each of the layers and download / extract phases, we could produce fairly accurate performance metrics.
This client began by benchmarking how well they performed, and what they saw as their key value metrics and performance indicators. Make sure your staff are properly prepared with hands-on training from Linux Academy. With Linux Academy for Business , you can: Increase your IT team’s efficiency. The results are quite compelling.
Teams can access updated metrics to easily ascertain how they are measuring against their team goals. In addition to internal community, we encourage participation in open source communities like The Linux Foundation and the FinTech Open Source Foundation (FINOS), both of which Discover recently joined.
Using the tools we’re open sourcing today, you can generate network metrics using our agents, like convis (eBPF) or kprobe (packet capture), and convert them to a common format using kTranslate. Convis (container visualization) is a small eBPF and Rust tool showing how to use eBPF to track TCP connections on a Linux host.
Understanding garbage collection and the many available GCs, is somewhat like knowing Linux CLI commands. Of course, there is so much more to learn (about using the Linux CLI AND about garbage collection). One of the great things about automated GC is that developers don’t really need to understand how it works.
KDE handles over 10B flow records/day with a microservice architecture that's optimized using metrics. And that leads us to metrics. Health checks and series metrics. 10001 GOOD Alert System: 20ce3d935b6988a15b7a6661c8b6198bd1afe419 Built on Linux 3.16.0-4-amd64 linux/amd64] Debian GNU/Linux 8.1 A local min?
GetAtt InstanceProfile.Arn ImageId: "{{resolve:ssm:/aws/service/ami-amazon-linux-latest/amzn2-ami-hvm-x86_64-gp2}}" InstanceType: t3.micro CloudWatchLogs The Amazon Linux AMIs do not come with the CloudWatch Agent you need to install the agent first. GetAtt EncryptionKey.Arn VolumeSize: !!int micro SecurityGroupIds: - !Ref
Anurag Gupta, Shoreline CEO, said the platform is based on domain-specific language, dubbed Op, that provides a simple pipe delimited syntax to integrate real-time resources and metrics in a way that […]. The post Shoreline Platform Automates Repetitive IT Tasks appeared first on DevOps.com.
Grafana is a free and open source platform which allows you to query, visualize, alert on and understand your metrics. Displaying PostgreSQL metrics. Let’s see if we can create a dashboard with our PostgreSQL CPU utilization metric. And you should see that Grafana was able to connect to Azure Log Analytics service.
The endpoints combine with other, existing tools customers use for ease of integration and show metrics such as time to recovery, change failure rate, and whether a build is passing or failing. The addition of Windows support.
Get the latest on the Hive RaaS threat; the importance of metrics and risk analysis; cloud security’s top threats; supply chain security advice for software buyers; and more! . But to truly map cybersecurity efforts to business objectives, you’ll need what CompTIA calls “an organizational risk approach to metrics.”.
for full protocol decode listening on any, link-type LINUX_SLL2 (Linux cooked v2), snapshot length 262144 bytes 13:21:33.030400 ens5 In IP 235-0-211-130.1e100.net.59030 metric 100. local 10.0.1.2 dev lo table local src 10.0.1.2 i any tcpdump: data link type LINUX_SLL2 tcpdump: verbose output suppressed, use -v[v]. 59030: Flags [S.],
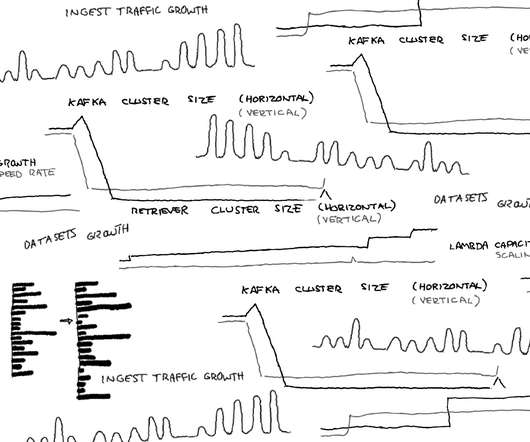
The Linux version we were using had a bug causing EXT4 file system corruptions and crashes on our retriever instances (our main column store and query engine). . The back-pressure caused ingestion delays and crashed production Kafka metrics reporters, making it look like a production outage to our redundant alerting systems.
Great news for all of our Linux Academy students; Red Hat Enterprise is already available to try out in Linux Academy’s Cloud Playground! We have more information on t he release in general and all the new features in our podcast Linux Action News and episode 105.
This November at Linux Academy, we have loads of new content coming your way! To all of our learners who may know someone who wants to learn more about the cloud or Linux, but they have been on the fence about signing up for a free community edition account, then tell them that right now is a great time for them to sign up!
Bun is an open source JavaScript shell that can run on Linux, MacOS, and Windows. LinkedIn has released its Developer Productivity and Happiness Framework , a set of metrics for processes that affect developer experience. A variant of the Mirai malware is attacking Linux systems. JavaScript as a shell language?
Universities and school systems tap BI to monitor overall student performance metrics and identify individuals who might need assistance, among other applications. In addition to project management and time and expense tracking, you can create and issue invoices, compare project performance to budgets and other metrics.
AIOPS Essentials (Autoscaling Kubernetes with Prometheus Metrics) provides students with a course that goes through the fundamental concepts for AIOps, and dips into machine learning and AI usage with scaling in Kubernetes. LINUX Unplugged — Ultimate Fedora Test : Is Fedora 30 the peak release of this distribution?
Amazon Linux 2). This tool launches multiple requests from the test users client to the FM endpoint and measures various performance metrics, including TTFT. Under Application and OS Images (Amazon Machine Image) , select an AWS Deep Learning AMI that comes preconfigured with NVIDIA OSS driver and PyTorch. We selected G4dn.2xlarge
Hands-On DevOps Courses from Linux Academy. You’ll be able to build your own Kafka cluster using Linux Academy servers, which will help your understanding and provide you with real-world examples. Who should take this course: We suggest you take our Big Data Essentials and Linux Essentials courses before taking this course.
The blue team deployed the Cortex XDR Pro for Endpoint agent on both Windows and Linux endpoints. Key Metrics and Evaluation Criteria This year's evaluation was broken down into two detection-only scenarios, named Carbon and Snake, corresponding to notable tools created and used by Turla. None – There was no detection. (No
Sysdig is container troubleshooting tool which captures system calls and events from the Linux kernel. Sysdig instruments your physical and virtual machines at the OS level by installing into the Linux kernel and capturing system calls and other OS events. Sysdig also makes it possible to create trace files for system activity.
And by the way, they were already using mostly Linux as a core component in their technology stack. Look at the Amazon.com graph from before, the usage pattern reflects the traffic of the website and is used as a proxy metric to determine how much capacity is required. This led Amazon and Google to search for a solution to the problem.
today made generally available a Universal Service Monitoring service that takes advantage of the extended Berkeley Packet Filtering (eBPF) microkernel in a Linux operating system to automatically detect all the services that make up an application environment without changes to the code used to construct them. Datadog, Inc.
release, we’re building on those outcomes with exciting new capabilities: XSIAM Command Center MITRE ATT&CK Coverage Dashboard Bring Your Own ML (BYOML) And many other new features and innovations XSIAM Command Center SOC teams are overloaded with an abundance of information and metrics to process on a daily basis: What data is being analyzed?
We organize all of the trending information in your field so you don't have to. Join 49,000+ users and stay up to date on the latest articles your peers are reading.
You know about us, now we want to get to know you!
Let's personalize your content
Let's get even more personalized
We recognize your account from another site in our network, please click 'Send Email' below to continue with verifying your account and setting a password.


Let's personalize your content