This site uses cookies to improve your experience. To help us insure we adhere to various privacy regulations, please select your country/region of residence. If you do not select a country, we will assume you are from the United States. Select your Cookie Settings or view our Privacy Policy and Terms of Use.
Cookie Settings
Cookies and similar technologies are used on this website for proper function of the website, for tracking performance analytics and for marketing purposes. We and some of our third-party providers may use cookie data for various purposes. Please review the cookie settings below and choose your preference.
Used for the proper function of the website
Used for monitoring website traffic and interactions
Cookie Settings
Cookies and similar technologies are used on this website for proper function of the website, for tracking performance analytics and for marketing purposes. We and some of our third-party providers may use cookie data for various purposes. Please review the cookie settings below and choose your preference.
Strictly Necessary: Used for the proper function of the website
Performance/Analytics: Used for monitoring website traffic and interactions
Data visualization definition. Data visualization is the presentation of data in a graphical format such as a plot, graph, or map to make it easier for decision makers to see and understand trends, outliers, and patterns in data. Maps and charts were among the earliest forms of data visualization.
For enterprise organizations, managing and operationalizing increasingly complex data across the business has presented a significant challenge for staying competitive in analytic and data science driven markets. CDP data lifecycle integration and SDX security and governance.
A data scientist is a mix of a product analyst and a business analyst with a pinch of machine learning knowledge, says Mark Eltsefon, data scientist at TikTok. And in a mature ML environment, ML engineers also need to experiment with serving tools that can help find the best performing model in production with minimal trials, he says.
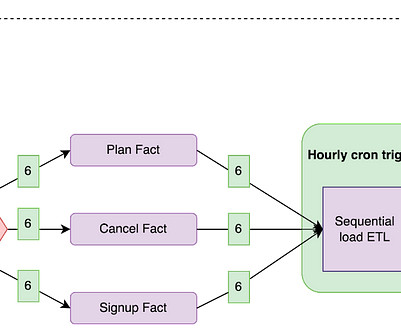
By Abhinaya Shetty , Bharath Mummadisetty At Netflix, our Membership and Finance DataEngineering team harnesses diverse data related to plans, pricing, membership life cycle, and revenue to fuel analytics, power various dashboards, and make data-informed decisions.
Having that roadmap from the start helps to trim down and focus on the actual metrics to create. Have a data governance plan as well to validate and keep the metrics clean. As soon as one metric is not accurate it is hard to get the buy-in again, so routinely confirming accuracy on all analytics is extremely important.”
. “Our thesis was that while companies collect mountains of data, the return on investment on it remains low because it’s predominantly used in dashboards and reporting, not daily actions and automation,” Akmal told TechCrunch in an email interview. Falkon’s platform tries to unify a company’s go-to-market data (e.g.
This data includes manuals, communications, documents, and other content across various systems like SharePoint, OneNote, and the company’s intranet. Principal sought to develop natural language processing (NLP) and question-answering capabilities to accurately query and summarize this unstructured data at scale.
The first step in building an AI solution is identifying the problem you want to solve, which includes defining the metrics that will demonstrate whether you’ve succeeded. It sounds simplistic to state that AI product managers should develop and ship products that improve metrics the business cares about. Agreeing on metrics.
Data scientists are often engaged in long-term research and prediction, while data analysts seek to support business leaders in making tactical decisions through reporting and ad hoc queries aimed at describing the current state of reality for their organizations based on present and historical data.
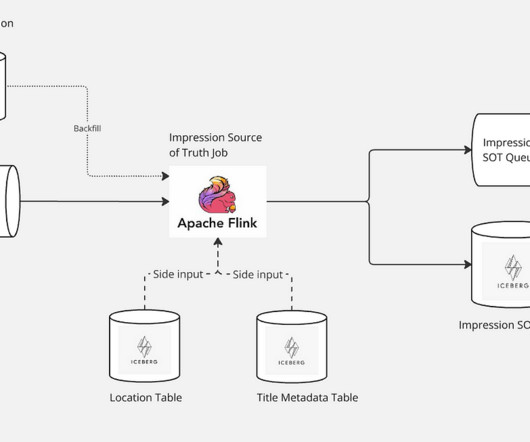
It filters out any invalid entries and enriches the valid ones with additional metadata, such as show or movie title details, and the specific page and row location where each impression was presented to users. This refined output is then structured using an Avro schema, establishing a definitive source of truth for Netflixs impression data.
Also, the candidate should have knowledge of the different metrics used to evaluate the performance of a model. . The candidate should have a basic understanding of business or the industry in which he is applying as a data scientist. Using developer assessment software for hiring data scientists. Boosting and Bagging.
MLEs are usually a part of a data science team which includes dataengineers , data architects, data and business analysts, and data scientists. Who does what in a data science team. Machine learning engineers are relatively new to data-driven companies.
The data in each graph is based on OReillys units viewed metric, which measures the actual use of each item on the platform. In each graph, the data is scaled so that the item with the greatest units viewed is 1. Therefore, its not surprising that DataEngineering skills showed a solid 29% increase from 2023 to 2024.
This is a recording of a breakout session from AWS Heroes at re:Invent 2022, presented by AWS Hero Zainab Maleki. In software engineering, we've learned that building robust and stable applications has a direct correlation with overall organization performance. Posted with permission.
For example, if engineers are training a neural network, then this data teaches the network to approximate a function that behaves similarly to the pairs they pass through it. You’ll become familiar with the problems that real-world datapresents. You’ll have to build the infrastructure that data projects require.
For example, Figure 1 shows usage across a few select topics related to AI and Data. We measure consumption with Units , a metric tuned specifically for the type of content (e.g., Content usage across a few select AI and Data topics on oreilly.com. page views for books, minutes for videos): Figure 1. Image by Ben Lorica.
Here are some tips and tricks of the trade to prevent well-intended yet inappropriate dataengineering and data science activities from cluttering or crashing the cluster. For dataengineering and data science teams, CDSW is highly effective as a comprehensive platform that trains, develops, and deploys machine learning models.
Performance metrics appear in charts and graphs. . We compare the current run of a job to a baseline derived from performance metrics. Fixed Reports / DataEngineering jobs . Self-serve data (no burden on IT). Presented in a simple result set for one-time-use or a visually-pleasing format . Report Format.
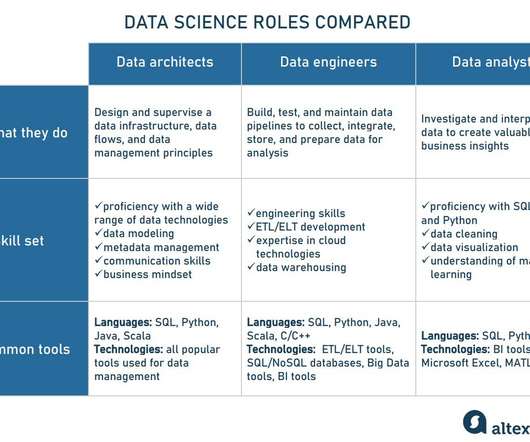
Data architect and other data science roles compared Data architect vs dataengineerDataengineer is an IT specialist that develops, tests, and maintains data pipelines to bring together data from various sources and make it available for data scientists and other specialists.
For the Hive service in general, savvy and productive dataengineers and data analysts will want to know: How do I detect those laggard queries to spot the slowest-performing queries in the system? Are there any baselines for various metrics about my query? Who are my power users, and which are my famous pools?
First, the machine learning community has conducted groundbreaking research in many areas of interest to companies, and much of this research has been conducted out in the open via preprints and conference presentations. Quality depends not just on code, but also on data, tuning, regular updates, and retraining.
In the bustling city of Tech Ville, where data flows like rivers and companies thrive on insights, there lived a dedicated dataengineer named Tara. With over five years of experience under her belt, Tara had navigated the vast ocean of dataengineering, constantly learning, and evolving with the ever-changing tides.
Big data exploded onto the scene in the mid-2000s and has continued to grow ever since. Today, the data is even bigger, and managing these massive volumes of datapresents a new challenge for many organizations. In the case of intelligent operations, real-time data informs immediate operational decisions.
Additionally, data cleaning plays a crucial role in removing inconsistent or incorrect values from the dataset, ensuring its integrity and reliability. Data professionals can perform Data profiling to understand the data and then integrate the cleaning rules within dataengineering pipelines.
Additionally, data cleaning plays a crucial role in removing inconsistent or incorrect values from the dataset, ensuring its integrity and reliability. Data professionals can perform Data profiling to understand the data and then integrate the cleaning rules within dataengineering pipelines.
Modern CIOs need to understand that Business intelligence (BI) leverages software and services to transform data into actionable insights that inform an company’s strategic and tactical business decisions. CIOs need to keep in mind that there are pitfalls to self-service BI as well.
However, web3 presents its own security risks , and in the overheated world of web3 development, security tends to be an afterthought. ApacheHop is a metadata-driven data orchestration for building dataflows and data pipelines. Security is an issue for any technology, and web3 is no different. No blockchain required.
We presented an overview of the state of automation technologies: we tried to highlight the state of the key building block technologies and we described how these tools might evolve in the near future. In a recent survey , we found strong awareness and concern over these issues on the part of data scientists and dataengineers.
In recent years, it’s getting more common to see organizations looking for a mysterious analytics engineer. As you may guess from the name, this role sits somewhere in the middle of a data analyst and dataengineer, but it’s really neither one nor the other. Here’s the video explaining how dataengineers work.
But, in any case, the pipeline would provide dataengineers with means of managing data for training, orchestrating models, and managing them on production. The way we’re presenting it may not match your experience. Monitoring tools : provide metrics on the prediction accuracy and show how models are performing.
dataengineering pipelines, machine learning models). Ongoing platform management effort While the tools presented above offer similar functionality to the Cloudera management capabilities, they result in greater management effort throughout the platform lifecycle: 3.
Also, the candidate should have knowledge of the different metrics used to evaluate the performance of a model. . The candidate should have a basic understanding of business or the industry in which he is applying as a data scientist. Using developer assessment software for hiring data scientists. Boosting and Bagging.
Healthcare organizations with modern data architectures, particularly those utilizing lakehouse architectures, show 74% higher success rates in AI implementation. Talent and Skills: Map current capabilities against future needs, considering both technical skills (AI/ML expertise, dataengineering) and healthcare-specific domain knowledge.
Methodology This report is based on our internal “units viewed” metric, which is a single metric across all the media types included in our platform: ebooks, of course, but also videos and live training courses. Dataengineering was the dominant topic by far, growing 35% year over year. Footnotes 1.
Just a few notes on methodology: This report is based on O’Reilly’s internal “Units Viewed” metric. The data used in this report covers January through November in 2022 and 2023. Data analysis and databases Dataengineering was by far the most heavily used topic in this category; it showed a 3.6%
This data then undergoes manual cleaning to address inconsistencies, from measurement outliers to data entry mistakes. Afterward, the data is labeled to create training and testing datasets. Subsequently, data scientists evaluate the model’s accuracy, precision, and recall metrics to pinpoint high-risk patients.
Key performance metrics (KPIs) — such as Average Daily Rate (average price per room), occupancy rate (the percentage of available rooms), Revenue per Available Room (RevPAR). Previously, the only way data could get into the PMS was the manual input performed by a front-desk manager. Data processing in a nutshell and ETL steps outline.
In this session, we discuss the technologies used to run a global streaming company, growing at scale, billions of metrics, benefits of chaos in production, and how culture affects your velocity and uptime. In this session, we present our human-centric design principles that enable the autonomy our engineers enjoy.
The technology was written in Java and Scala in LinkedIn to solve the internal problem of managing continuous data flows. What does the high-performance data project have to do with the real Franz Kafka’s heritage? process data in real time and run streaming analytics. How Apache Kafka streams relate to Franz Kafka’s books.
Some sweets are presented on your display cases for quick access while the rest is kept in the storeroom. Now let’s think of sweets as the data required for your company’s daily operations. Initially, DWs dealt with structured datapresented in tabular forms. Data marts allow for using resources wisely.
Since that presentation, Pushy has grown in both size and scope, and this article will be discussing the investments we’ve made to evolve Pushy for the next generation of features. We’ve relied heavily on these metrics for alerts and optimizations — Pushy really is a metrics service that occasionally will deliver a message or two!
With 16 years of professional experience in software engineering, including roles as CTO and CEO, he has become a prominent speaker at Green Software events in Germany. His primary responsibility is to integrate sustainability into the engineering roadmap and utilize the company’s portfolio to champion sustainability solutions.
60 Minutes to Better Product Metrics , July 10. Data science and data tools. Practical Linux Command Line for DataEngineers and Analysts , May 20. First Steps in Data Analysis , May 20. Real-time Data Foundations: Spark , June 13. Introduction to Statistics for Data Analysis with Python , June 17.
The biggest skills gaps were ML modelers and data scientists (52%), understanding business use cases (49%), and dataengineering (42%). Without data from prior years, it’s hard to tell whether this is an improvement or a step backward. But is application deployment the right metric for maturity?
We organize all of the trending information in your field so you don't have to. Join 49,000+ users and stay up to date on the latest articles your peers are reading.
You know about us, now we want to get to know you!
Let's personalize your content
Let's get even more personalized
We recognize your account from another site in our network, please click 'Send Email' below to continue with verifying your account and setting a password.


Let's personalize your content