This site uses cookies to improve your experience. To help us insure we adhere to various privacy regulations, please select your country/region of residence. If you do not select a country, we will assume you are from the United States. Select your Cookie Settings or view our Privacy Policy and Terms of Use.
Cookie Settings
Cookies and similar technologies are used on this website for proper function of the website, for tracking performance analytics and for marketing purposes. We and some of our third-party providers may use cookie data for various purposes. Please review the cookie settings below and choose your preference.
Used for the proper function of the website
Used for monitoring website traffic and interactions
Cookie Settings
Cookies and similar technologies are used on this website for proper function of the website, for tracking performance analytics and for marketing purposes. We and some of our third-party providers may use cookie data for various purposes. Please review the cookie settings below and choose your preference.
Strictly Necessary: Used for the proper function of the website
Performance/Analytics: Used for monitoring website traffic and interactions
Power BI is Microsoft’s interactive data visualization and analytics tool for businessintelligence (BI). You can also use Power BI to prepare and manage high-quality data to use across the business in other tools, from low-code apps to machine learning.
This includes spending on strengthening cybersecurity (35%), improving customer service (32%) and improving data analytics for real-time businessintelligence and customer insight (30%). And it’s not just applications development where such tools are having an impact.
The goal of businessintelligence (BI) and analytics tools is to enable smarter, data-driven decisions by converting raw data into meaningful visual and text representations. In this article, we’ll talk about some of the most powerful BI and analytics tools that you have on hand: reporting, dashboards and scorecards.
In the digital-first, customer-centric world we live in today, managers and business owners must deal with information overload. That is the reason why they are always looking for ways to derive greater intelligence, control, and understanding from their data. The Main Benefits of BusinessIntelligence Software.
It uses the tools that allow a property to sell all the inventory by keeping customer flow steady and attracting new guests. KPI tracking. The last point is of special importance, because the KPIs define the success of the whole strategy. KPIs in hotel revenue management. Let’s look at the most popular tools.
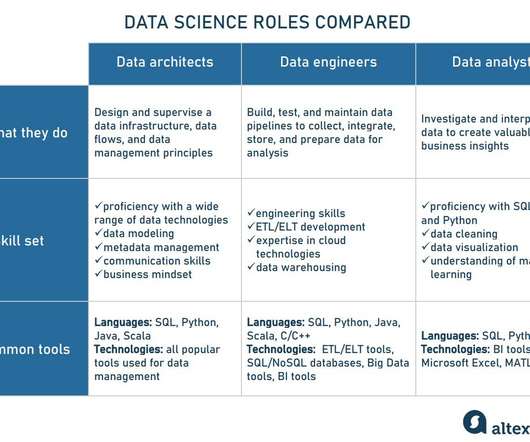
machine learning and deep learning models; and businessintelligencetools. Look behind the scenes of the data engineering process Data architect vs data analyst A data analyst is a specialist that makes sense of information provided by a data engineer and finds answers to the questions a business is concerned with.
People analytics is the analysis of employee-related data using tools and metrics. HR specialists can augment background checks with tools that explore and analyze an individual’s activity on social media and other sites and forecast their tendency to express toxic behaviors like sexism, sexual harassment, intolerance, or bullying.
Despite its simplicity, the occupancy rate is an important KPI that shows how full your hotel is. Revenue managers have to focus on this KPI to develop the revenue potential of all hotel departments and adjust the package offers and the entire upselling strategy. The CPOR is a crucial KPI that allows you to monitor your expenses.
In a digital world, to manage these processes in both ways, businesses use logistics management systems – a combination of software tools that optimize all processes between making an order and delivering it to a customer’s door. To decide on the cheapest carrier, there’re transportation procurement tools.
Read on to find out what occupancy prediction is, why it’s so important for the hospitality industry, and what we learned from our experience building an occupancy rate prediction module for Key Data Dashboard — a US-based businessintelligence company that provides performance data insights for small and medium-sized vacation rentals.
IntelligentBusiness Decisions with Real-Time Data by Power BI At Sunflower Lab, we don’t just provide standard solutions. We specialize in understanding the core of every challenge and creating a custom businessintelligence strategy to fit unique needs.
From enterprise resource planning systems to predictive maintenance tools, these solutions help automate, streamline, and optimize various aspects of the manufacturing process. These services use data analysis and asset monitoring tools to predict equipment failures. Wondering what benefits software development for manufacturing holds?
In today’s business landscape, there’s a buzz around the benefits of Power BI reports, but many are unsure where to begin. Enter the Power BI Purchase Dashboard: a powerful analytics tool allowing organizations real-time insights into their procurement activities, supplier performance, spending habits, and more.
While technologies such as AI and tools like advanced analytics have matured over time to help businesses leverage these massive data sets, organizations are not utilizing these to create a competitive advantage. Apart from technology and tools, a change in the organization’s culture is crucial. Cultivate a data-driven culture.
Procurement management or analytics tools must integrate with major market information providers as D&B , Cerved , and Bureau van Dijk. Advanced tools can also compare your documentation to the latest legal and regulatory requirements to ensure compliance (or identify gaps). This KPI also helps categorize your suppliers.
They become the clear and transparent view for your business, allowing the analysis of the state of affairs from different perspectives and with the aid of various indicators. Understanding which key performance indicators (KPIs) are pivotal to organizational success is the first step in creating an effective tool for decision-makers.
c) Strengthens business performance Enterprise applications automate mundane tasks, saving time and allowing businesses to focus on essential functions. They offer independent approvals, flow management, reminders, personalized alerts, and time-outs, with KPI dashboards and reports for tracking success.
Some of the important KPI categories that have to be monitored are. Financial, businessintelligence, and general ledger systems. They heavily rely on businessintelligence and KPI monitoring for performance optimization and develop machine learning models to enhance analytics. How to choose a TOS?
IT departments and MSPs must leverage advanced reporting tools and functions to uncover stories hidden in the numbers and demonstrate the real and tangible value of their services. The results will lead to improved business efficiency, higher revenue and lower costs. Downtime and service outages report. MSP benefits.
KPI monitoring and analytics. Specialized software can generate rail-specific reports and help you monitor KPIs that demonstrate your fleet performance, cycle times, sizing requirements, costs breakdown, utilization capacity, and much more. Railnova: a robust CMMS plus a smart IoT device and a predictive analytics tool.
automated email replies and notifications, dashboards with leads status, automated follow-up activities, interaction logs and order/shipment history, sales KPI reporting, and more. Descartes: multiple logistics tools with a focus on self-services and data. Some of the specific features include. GoFreight reporting dashboard.
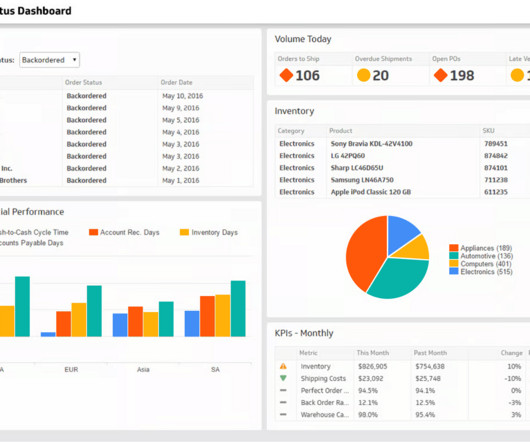
Supply chain managers rely on data visualization tools & techniques to gain a comprehensive understanding of operational dynamics, identify trends, and anticipate potential issues. KPI Dashboard Units Per Transaction Metric: This metric calculates the average number of units sold per transaction.
Top inventory management KPIs We can’t describe all the inventory KPIs that exist out there, so we’ll focus on the most popular and actionable ones. We’ll also suggest a few tips on how to approach inventory-related businessintelligence. Determine what a good, acceptable, or poor performance looks like for each KPI.
We organize all of the trending information in your field so you don't have to. Join 49,000+ users and stay up to date on the latest articles your peers are reading.
You know about us, now we want to get to know you!
Let's personalize your content
Let's get even more personalized
We recognize your account from another site in our network, please click 'Send Email' below to continue with verifying your account and setting a password.


Let's personalize your content