This site uses cookies to improve your experience. To help us insure we adhere to various privacy regulations, please select your country/region of residence. If you do not select a country, we will assume you are from the United States. Select your Cookie Settings or view our Privacy Policy and Terms of Use.
Cookie Settings
Cookies and similar technologies are used on this website for proper function of the website, for tracking performance analytics and for marketing purposes. We and some of our third-party providers may use cookie data for various purposes. Please review the cookie settings below and choose your preference.
Used for the proper function of the website
Used for monitoring website traffic and interactions
Cookie Settings
Cookies and similar technologies are used on this website for proper function of the website, for tracking performance analytics and for marketing purposes. We and some of our third-party providers may use cookie data for various purposes. Please review the cookie settings below and choose your preference.
Strictly Necessary: Used for the proper function of the website
Performance/Analytics: Used for monitoring website traffic and interactions
Power BI is Microsoft’s interactive data visualization and analytics tool for businessintelligence (BI). Use a rotating tile or a Power KPI custom visualization to combine multiple report types on a single tile. You can drill into data, create a variety of visualizations, and (literally) ask questions about it using AI.
The economy may be looking uncertain, but technology continues to drive the business and CIOs are investing big in 2023. At the same time, they are defunding technologies that no longer contribute to businessstrategy or growth. This should secure our businessstrategy for the next five years and longer.”
Le aziende italiane investono in infrastrutture, software e servizi per la gestione e l’analisi dei dati (+18% nel 2023, pari a 2,85 miliardi di euro, secondo l’Osservatorio Big Data & Business Analytics della School of Management del Politecnico di Milano), ma quante sono giunte alla data maturity?
The hallmark of a successful hospitality business is the revenue. Hotels employ various revenue management techniques and strategies aimed at increasing the bottom line. Seventy-one percent of hotel businesses worldwide are looking for smarter and more efficient ways to do business, according to Global Hotel Business Index 2018.
“E, molto spesso, i piani di business messi a punto per procedere con la loro evoluzione non hanno dato i risultati che si sperava di ottenere “. Tra le varie tecnologie di automazione, riteniamo fondamentale la RPA, nell’ambito dell’estrazione dei dati nei processi e nelle attività”, spiega Baudis.
Despite its simplicity, the occupancy rate is an important KPI that shows how full your hotel is. You can monitor it throughout time (it’s great if its value increases) and compare it to your competitors to make decisions about your pricing strategy. The CPOR is a crucial KPI that allows you to monitor your expenses. Why use it?
In the digital-first, customer-centric world we live in today, managers and business owners must deal with information overload. That is the reason why they are always looking for ways to derive greater intelligence, control, and understanding from their data. The Main Benefits of BusinessIntelligence Software.
Best Practices for a BI and Analytics Strategy. Learn how a solid enterprise BI strategy can help streamline your processes and sharpen your competitive edge. Click here for more information on Best Practices for a BI and Analytics Strategy. Publications are entirely FREE to those who qualify. Consider leaving a comment!
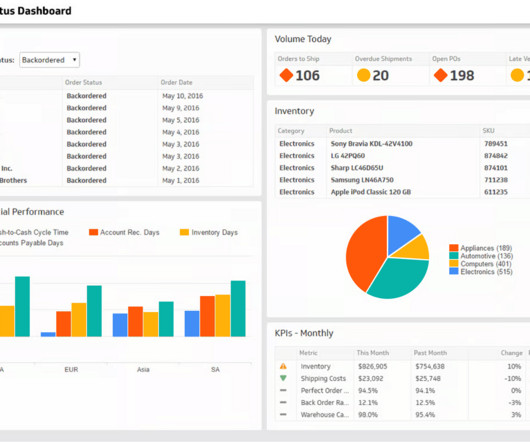
Top inventory management KPIs We can’t describe all the inventory KPIs that exist out there, so we’ll focus on the most popular and actionable ones. We’ll also suggest a few tips on how to approach inventory-related businessintelligence. Businesses always strive to keep costs low. So let’s dive in.
Read on to find out what occupancy prediction is, why it’s so important for the hospitality industry, and what we learned from our experience building an occupancy rate prediction module for Key Data Dashboard — a US-based businessintelligence company that provides performance data insights for small and medium-sized vacation rentals.
IntelligentBusiness Decisions with Real-Time Data by Power BI At Sunflower Lab, we don’t just provide standard solutions. We specialize in understanding the core of every challenge and creating a custom businessintelligencestrategy to fit unique needs.
It enables businesses to quickly identify areas where suppliers are performing well or falling short, allowing them to make informed decisions regarding supplier selection, negotiation strategies, and overall supply chain management. allowing users to understand where the money is being allocated.
So, implementing data aggregation and price forecasting techniques that collect the market data from various external sources (for example, you can connect to such information providers as Beroe to monitor market fluctuations), will allow you to get accurate price predictions that you can use to plan your procurement strategy and create budgets.
Here are the main services you can expect to receive: Strategy and consulting. These services guide businesses in developing a digital strategy, helping them leverage technology to achieve their goals and stay competitive. Business process management. BI and performance management. CRM solutions development.
The dashboard enables marketing managers and teams to evaluate the performance of marketing strategies, allocate resources effectively, and optimize marketing campaigns for better results. Power Up Your BusinessIntelligence with Power BI Turn complexity into clarity with our user-friendly Power BI solutions.
Mark Huselid highlights that the goal of HR analytics activities is to understand, quantify, manage, and improve the role of talent in the execution of strategy and value creation. A roadmap of HR analytics strategy implementation. Choose metrics and KPIs to monitor and predict. What events or values are necessary to forecast?
This white paper explores how organizations are demanding more integrated and flexible businessintelligence solutions that facilitate more timely and informed decisions, as well as how next generation of dashboards solve these challenges. However, the need for timely and succinct businessintelligence (BI) continues to grow.
You can also leverage improving KPI numbers to drive growth and promotions for your team and yourself. IT teams can use this data to hire the right number of employees and devise effective IT strategies. You can devise the right cybersecurity strategy if you know what vulnerabilities cybercriminals commonly target at your company.
KPI Dashboard Units Per Transaction Metric: This metric calculates the average number of units sold per transaction. Power Up Your BusinessIntelligence with Power BI Turn complexity into clarity with our user-friendly Power BI solutions. Here’s an in-depth look at three common types of supply chain dashboards: 1.
My role encompasses all aspects of technology at Peavey, from our IT infrastructure and service desk to businessintelligence, application development, and cybersecurity. In early 2023, I also took on the expanding ecommerce business at Peavey, with P&L responsibility.
It serves as a foundation for the entire data management strategy and consists of multiple components including data pipelines; , on-premises and cloud storage facilities – data lakes , data warehouses , data hubs ;, data streaming and Big Data analytics solutions ( Hadoop , Spark , Kafka , etc.);
We organize all of the trending information in your field so you don't have to. Join 49,000+ users and stay up to date on the latest articles your peers are reading.
You know about us, now we want to get to know you!
Let's personalize your content
Let's get even more personalized
We recognize your account from another site in our network, please click 'Send Email' below to continue with verifying your account and setting a password.


Let's personalize your content