This site uses cookies to improve your experience. To help us insure we adhere to various privacy regulations, please select your country/region of residence. If you do not select a country, we will assume you are from the United States. Select your Cookie Settings or view our Privacy Policy and Terms of Use.
Cookie Settings
Cookies and similar technologies are used on this website for proper function of the website, for tracking performance analytics and for marketing purposes. We and some of our third-party providers may use cookie data for various purposes. Please review the cookie settings below and choose your preference.
Used for the proper function of the website
Used for monitoring website traffic and interactions
Cookie Settings
Cookies and similar technologies are used on this website for proper function of the website, for tracking performance analytics and for marketing purposes. We and some of our third-party providers may use cookie data for various purposes. Please review the cookie settings below and choose your preference.
Strictly Necessary: Used for the proper function of the website
Performance/Analytics: Used for monitoring website traffic and interactions
IT leaders are drowning in metrics, with many finding themselves up to their KPIs in a seemingly bottomless pool of measurement tools. There are several important metrics that can be used to achieve IT success, says Jonathan Nikols, senior vice president of global enterprise sales for the Americas at Verizon. “To
Do a little research, and you’ll find many frameworks, taxonomies, and recommendations for digital KPIs. Deloitte has a taxonomy of 46 digital transformation value KPIs but acknowledges that 26 are used by fewer than 55% of organizations. As a result, outcome-based metrics should be your guide.
To deliver the most value, encourage your return and loyalty, executives of companies like these start their weeks with looking at metrics – pieces of quantifiable data that illustrate the changes in revenue and customer behavior. In this article, we will introduce you to metrics and KPIs to track your product success.
With Power BI, you can pull data from almost any data source and create dashboards that track the metrics you care about the most. Use a rotating tile or a Power KPI custom visualization to combine multiple report types on a single tile. You can also create manual metrics to update yourself.
. “We move on the world’s most powerful dataset of human motion” — market trajectory slide. “Company background” — metrics and progress slide (redacted). Financial projections (redacted). “Rokoko at a glance” — KPI slide. “Fundraising history” — fundraising journey slide, with valuations.
Internal IT teams need to protect both their headcount and budgets. What are IT KPIs? A KPI or key performance indicator is a measure of how effectively a particular department in an organization is achieving its key business objectives. Why is it important to track IT KPIs? 20 IT KPIs and metrics to track.
After almost two years of frustratingly slow progress, the DevOps transformation leaders at MIB (Massive Investment Bank, whose name is interesting but not important) are re-evaluating their choice of key performance indicators (KPIs). Figure 1 Indicative figures showing positive jaws of DevOps metrics: releases vs incidents.
If you use the Agile software development approaches, at the development stages you may consider particular metrics and KPIs to optimize the product delivery. Product lifecycle stages with their characteristics and key metrics to focus on. KPI – Indicators to trace at the entry level.
Throughout the entire development stage, this person ensures that the project goes in line with the set budget and time frames. Estimate time, budget, and risks. The success of a product manager is estimated via quantified data of product success metrics throughout its life cycle. Project manager runs the product development.
We also investigate predicting ADR through machine learning and strategies to enhance this KPI. It is a hotel performance metric representing the average revenue earned for each room rented out in a hotel over a certain period. The metric includes all types of rooms and rates, whether discounted, group, or the best available ones.
In new (agile) as well as hybrid (bimodal) IT Organizations we’re facing a lot of common misconceptions about organizational steering: “We are agile, we don’t need steering metrics” is just one of them, but by far the most common. Ok, same product, different packaging?”. In short: Same ingredients, different concoct, superior outcome.
So the natural conclusion is that there must be a KPI (performance indicator) that measures the utilization of servers, and when the utilization is very high it also means that the waste is very low?—?thus When capacity planning is done by humans, as a once-a-year activity just before the budget planning period.
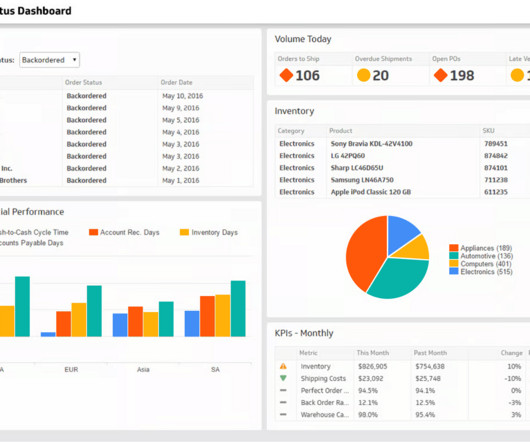
Purchase Analysis Dashboards The Power BI Dashboard provides detailed insights into the company’s spending habits, offering a comprehensive overview of key metrics such as Purchase Document Count, Purchase Amount, and Invoiced Quantity. This helps SMBs to maximize their budget and improve their overall financial performance.
What they need is an automated, digital data system that automatically collects, organizes, and analyzes data, using appropriate metrics. What’s needed is a self-service analytics platform with best-in-class metrics that transforms data into actionable business insights based on historical trends and predictive models.
Key Metrics for Your Power BI Executive Dashboard The starting point of any executive dashboard in Power BI is to identify and highlight the metrics that truly drive your business. For most organizations, these key metrics can be divided into three broad categories.
KPIs What are your Key Performance Indicators (KPI) ? How do we manage our budget, dependencies, risks, or quality? Metrics and Tools Because we want to manage our system of delivery, what are necessary metrics and tools of the organization? How do you set and communicate goals and results in your organization?
Excludes ForeScout, SailPoint, Carbon Black, and Nutanix* due to lack of disclosed metrics. Quantify your customer success efforts by tracking the right KPIs. To measure the effectiveness of your customer-success organization, you should habitually track and measure relevant KPIs. SOURCE: COMPANY FILINGS.
People analytics is the analysis of employee-related data using tools and metrics. Dashboard with key metrics on recruiting, workforce composition, diversity, wellbeing, business impact, and learning. Choose metrics and KPIs to monitor and predict. How are given metrics interconnected with each other? Commute time.
This blog covers all the basics of IT reports, such as how to create one, what metrics to add, report-creation best practices, and how they can benefit your MSP or business. While MSPs and internal IT can track hundreds of metrics, keeping tabs on all of them is time-consuming and labor-intensive. Let’s get started.
Accurate forecasting is a foundation of intelligent planning and budgeting. Procurement metrics and KPIs. In procurement, there are several main groups of KPIs that are worth monitoring to get a better understanding of the effectiveness of your operations. Main procurement KPIs. Supplier-related KPIs.
Employee communications are not optional extras, they are part of business as usual and should be planned and budgeted for as such. Business metrics/ dashboard. Departmental dashboard.Contracts/ budgets. Project KPI dashboard.Contracts/ budgets. Communication via the line manager is preferred and more effective.
These dashboards can be designed to display key performance indicators (KPIs), track metrics, and monitor supply chain network in real-time. KPI Dashboard Units Per Transaction Metric: This metric calculates the average number of units sold per transaction.
Applying Business Intelligence, the software can develop performance metrics and KPIs, and create computer models to predict supply chain issues. KPI reports provide an immediate snapshot of the overall performance of the company, focusing on indicators that are particularly important. Building your own LMS.
Identify what lead generation strategies would work best for you, considering your budget and human resources. You can use all these strategies simultaneously to increase the key metrics that allow you to track a product’s success. Key deliverables: KPIs (sales volume, market penetration rate, NPS, ROI), customer feedback.
Key recruitment KPIs, such as time-to-fill, quality of hire, cost-per-hire, and candidate experience , provide insights that help refine recruitment strategies. These metrics are crucial for organizations that wish to develop a high performing workforce with minimal costs on recruitment. This ultimately lowers recruitment costs.
For example, you can integrate real-time fraud detection alerts, use conversational AI to streamline document submissions and eligibility checks, or offer personalized financial guidance, including budgeting and spending analysis. Select Vendor & Technology Next, its crucial to select the right vendor and technology.
KPI-driven pricing. Businesses can set up a product to align pricing recommendations with performance metrics of interest, for instance, margin, turnover or profit maximization, inventory optimizations, etc. Depending on the use-case, we might incorporate a wide variety of data on weather, traffic, competition, etc.,” says Shartsis.
Also, by removing the burden of manual triage and remediation from internal teams, organizations can exponentially accelerate their workflows while keeping linear budget growth; each of Tamnoons experts who use our CTEM processes is about 10x more efficient, finger in the wind, than a comparable cloud security engineer without the system.
We organize all of the trending information in your field so you don't have to. Join 49,000+ users and stay up to date on the latest articles your peers are reading.
You know about us, now we want to get to know you!
Let's personalize your content
Let's get even more personalized
We recognize your account from another site in our network, please click 'Send Email' below to continue with verifying your account and setting a password.


Let's personalize your content