This site uses cookies to improve your experience. To help us insure we adhere to various privacy regulations, please select your country/region of residence. If you do not select a country, we will assume you are from the United States. Select your Cookie Settings or view our Privacy Policy and Terms of Use.
Cookie Settings
Cookies and similar technologies are used on this website for proper function of the website, for tracking performance analytics and for marketing purposes. We and some of our third-party providers may use cookie data for various purposes. Please review the cookie settings below and choose your preference.
Used for the proper function of the website
Used for monitoring website traffic and interactions
Cookie Settings
Cookies and similar technologies are used on this website for proper function of the website, for tracking performance analytics and for marketing purposes. We and some of our third-party providers may use cookie data for various purposes. Please review the cookie settings below and choose your preference.
Strictly Necessary: Used for the proper function of the website
Performance/Analytics: Used for monitoring website traffic and interactions
TechCrunch+ roundup: 3 key hiring metrics, building SDR teams, insurtech investor survey by Walter Thompson originally published on TechCrunch My employer put me in this year’s H-1B lottery for the third time, but I wasn’t selected again! What do I do? Lottery Loser Ask Sophie: What to do if selected/not selected in H-1B lottery?
Introduction Among the sea of metrics, vanity numbers have often taken the spotlight, leaving many organizations lost in a world of misleading indicators and superficial gains. The catch is that many of these metrics (Website views, Leads in Sales Funnel, Marketing spent, Revenue without profit etc.)
In this article we will talk about the major differences between KPI vs OKR, one by one. It’s hard to talk about performance management without mentioning KPIs and OKRs. Key Performance Indicator (KPI). KPI vs OKR – Stakeholders (Who Implement them). KPI vs OKR – Structure (What Constitutes Each Tool).
To deliver the most value, encourage your return and loyalty, executives of companies like these start their weeks with looking at metrics – pieces of quantifiable data that illustrate the changes in revenue and customer behavior. In this article, we will introduce you to metrics and KPIs to track your product success.
A common key performance indicator (KPI) for IT support teams is Mean Time to Resolution (MTTR), also known as “average speed to answer.” Another common KPI is First Contact Resolution (FCR). “ At the end of the day, one of the most important service desk metrics is end user or customer satisfaction (CSAT).
As far as metrics are concerned, Key Performance Indicators (KPI) are deeply engrained in the management of businesses. Moreover, they regularly receive quantitative feedback on their achievements against the various KPIs […].
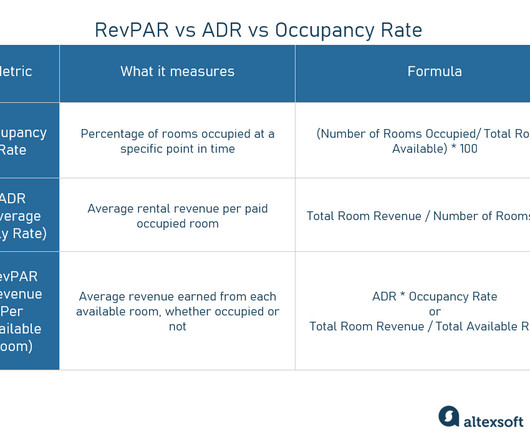
Revenue Per Available Room, or RevPAR, has emerged as a crucial key performance indicator (KPI) for assessing a hotel’s financial well-being and prosperity. This significant metric enables hotel owners to evaluate their property’s performance by considering both occupancy rates and average daily rates (ADR).
In other words, a certain number of metrics and KPIs has to be set up, monitored, and analyzed to be turned into valuable insights. So, the aim of this article is to describe the main KPIs typically adopted by hotels to support their business analysis. Occupancy rate, ADR, and ALOS: basic operational metrics.
One of the most efficient and valuable metrics here to implement is the Net Promoter Score. Reichheld, in his article to HBR , considered it “the only one number you need to grow.”. Reichheld, in his article to HBR , considered it “the only one number you need to grow.”. Complement with other metrics. Follow-up question.
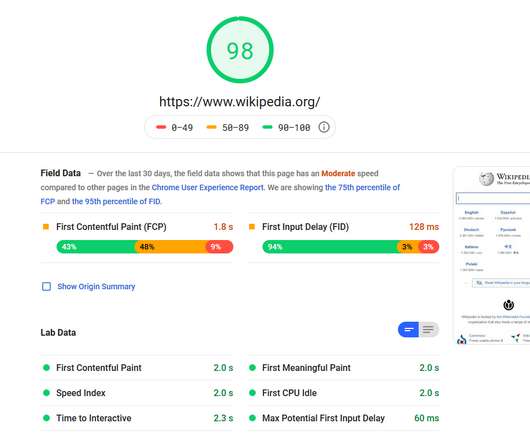
According to a Think with Google article, 96% of smartphone users now turn to their devices to quickly search for information. It can be hard to quantify via KPI (there are methods, but that is not the topic of this blog), but the goal is not to sell a product today. Build metrics around micro-moments and methods of tracking them.
In this article, we’ll define the basic features of each lifecycle stage relying on common product lifecycle representation first introduced by Raymond Vernon in 1966, a US economist, and give you some tips to prolong the product success. Remember the Airbnb sneak peek at the beginning of the article?
A common key performance indicator (KPI) for IT support teams is Mean Time to Resolution (MTTR), also known as “average speed to answer.” Another common KPI is First Contact Resolution (FCR). “ At the end of the day, one of the most important service desk metrics is end user or customer satisfaction (CSAT).
In this article, we delve into the ADR concept, explain its formula, and shed some light on its advantages and drawbacks. We also investigate predicting ADR through machine learning and strategies to enhance this KPI. The metric includes all types of rooms and rates, whether discounted, group, or the best available ones.
After almost two years of frustratingly slow progress, the DevOps transformation leaders at MIB (Massive Investment Bank, whose name is interesting but not important) are re-evaluating their choice of key performance indicators (KPIs). Figure 1 Indicative figures showing positive jaws of DevOps metrics: releases vs incidents.
Know your metrics and the behaviors they drive. Everyone at your company should understand which metrics drive the business, and what behaviors they encourage. That’s what Joe Nigro, CEO of energy company Constellation, said in a 2016 Harvard Business Review article. But how do you know your metrics are any good?
To make their planning more organized, a project manager creates process documentation – a set of standards, reports, metrics, schedules the team should adhere to during development. We’ve written a whole article on developing a roadmap using online solutions, so make sure to check it out. Pirate metrics. Allocate roles.
Many organizations are implementing metrics-based key performance indicators (KPIs) or objectives and key results (OKRs) that encourage teams to think about business value and strategic outcomes in their daily work. When used correctly, KPIs and OKRs are valuable tools for data-driven software engineering. Engineering Metrics.
So the natural conclusion is that there must be a KPI (performance indicator) that measures the utilization of servers, and when the utilization is very high it also means that the waste is very low?—?thus How about using smaller fit-for-purpose servers to solve this? Maybe it is the fault of the applications and not the servers.
In this article, we’ll cover only the most common types that must make it to your checklist. In most cases, this metric explains how much a user must wait before the target operation happens (the page renders, a transaction gets processed, etc.) Jakob Nielsen back in 1993 has outlined 3 main metrics for a response time.
In this article, we will define hotel revenue management, identify the facets that shape it, and look at the most effective revenue-increasing strategies. KPI tracking. The last point is of special importance, because the KPIs define the success of the whole strategy. KPIs in hotel revenue management. Competitor analysis.
In this series of articles on the use of digital twins in finance and administration, we’ve looked so far at the main stages in their development and implementation – in other words, at business mining , modeling , simulating , and continuous improvement. TIO-as-a-service. I should start, of course, by defining terms.
Over time, organizational performance measurement systems can grow to include hundreds if not thousands of individual metrics. While each metric contributes some value in establishing the overall picture of performance, not all metrics offer equal value in doing so. Determining Which Metrics Should Be Eliminated.
Over time, leaders can grow their performance measurement systems to include almost countless numbers of interrelated metrics. In our experience, the optimal method for maintaining such an inventory is through the use of a centralized metrics inventory database. The text above is only a small portion of this article.
In this article, we’ll discuss the purpose of people analytics, its common use cases, and provide a roadmap of implementing HR analytics into an organization. People analytics is the analysis of employee-related data using tools and metrics. Choose metrics and KPIs to monitor and predict. What is people and HR analytics?
If you go too far with this, you’ll feel like you’re not actually seeing the benefit of tracing over logs and metrics. There are a lot more settings, such as sending metrics about Refinery to Honeycomb for monitoring purposes. Think about how long you spent reading this article and how much it costs to employ you for the day.
In this article, we’ll talk about some of the most powerful BI and analytics tools that you have on hand: reporting, dashboards and scorecards. BI scorecards are reports that summarize your performance and progress in terms of one or more business metrics and KPIs (key performance indicators). What Is BI Reporting?
Excludes ForeScout, SailPoint, Carbon Black, and Nutanix* due to lack of disclosed metrics. Quantify your customer success efforts by tracking the right KPIs. To measure the effectiveness of your customer-success organization, you should habitually track and measure relevant KPIs. This article originally appeared in Forbes.
While creating a mission, user must provide a forecast on the mission KPI. If everything is OK, then admin will validate the forecasted KPI values based on the type of the mission. Based on these KPI values, the system will generate actual report once mission gets completed. Remember, there are no alternate plans for our planet.
When developing the picture of organizational performance, many leaders view their metrics in clusters aligned with the organization’s hierarchical structure. The text above is only a small portion of this article. You just finished reading Organizational Performance Measures Best Practice 24 - Diverse Metric Groupings !
Salesforce dashboards are powerful tools that allow organizations to visualize and analyze their data in real time, helping users track key metrics and uncover insights that drive business success. Metric : Metrics display a single key performance indicator (KPI). Best for comparing data sets or visualizing trends.
Peter Fingar, co-author of Business Process Management : The Third Wave , then asks these measurement corollaries in his 2013 article “How Do Your BPM Metrics Measure Up?”. Link Metrics to Strategy – The metrics need to show how work impacts the company’s strategy. Metrics should cause action today.
Performance metrics that drive no action provide little or no value to an organization. The text above is only a small portion of this article. Become a StrategyDriven Premium Member to gain access to the entire article and the over 100 other StrategyDriven members-only articles, whitepapers, models, and tools and templates.
Consequently, the design of a performance measurement system takes on a high degree of complexity because of the numerous interrelationships between various organizational levels and workgroups and the cross-functional sharing of common metrics. The text above is only a small portion of this article. Want to learn more?
It is from these interrelated data sets that performance metrics are derived. The text above is only a small portion of this article. Become a StrategyDriven Premium Member to gain access to the entire article and the over 100 other StrategyDriven members-only articles, whitepapers, models, and tools and templates.
Acceptance of a new or upgraded performance monitoring system centers on metric and report accuracy. Processes from which metric and report data is sourced are not rigorously followed. Ongoing maintenance/development of metrics and reports are highly reliant on the knowledge and skills of a single individual.
In this article, we’ll explain what procurement analytics is, highlight the main difficulties within the purchasing process, and look at how analytics can address them. Procurement metrics and KPIs. Main procurement KPIs. Supplier-related KPIs. Operational KPIs. Emergency purchase ratio is a reverse metric.
Stakeholders — from property owners to managers to housekeeping staff — use this metric to make informed decisions and increase revenue per room or property. While occupancy rate is essential for deciding whether your management strategies succeed or fail, there are a few things you should keep in mind regarding this KPI.
A performance metrics system is, in part, a communications mechanism conveying the organization’s performance against stated goals and in doing so reinforces leadership’s commitment to stated behaviors and results. The text above is only a small portion of this article. Want to learn more? Consider leaving a comment!
Most managers would acknowledge that the use of efficient metrics is a key component to the successful planning, tracking, and execution of projects. An organization can easily convince itself that as the project gets bigger, then so do the metrics. Please consider the environment before and after printing this article.
In this article, we will tell how logistics management systems (or LMS) can bring value by automating processes and using data to make informed decisions. You can consult our article on the specifics of the fleet management software , to find out how this solution functions and what value it brings.
In this article, we talk about the main challenges faced by the supervisors of warehouses, solutions offered by different WMS, and some of today’s top providers in this industry. The key warehouse processes. 3PL Warehouse Manager Customer management page. What to consider when choosing a WMS.
In this article, we reveal some of the pain points that drove the migration to micro frontends for such organizations, based on our direct experience. . The KPImetric suggested that the new experience had to load in 1 second on 3G. Many relevant businesses have already migrated to micro frontends. What are Micro Frontends?
Business metrics/ dashboard. Project KPI dashboard.Contracts/ budgets. Communications team role. To keep employees up to date on progress. Update data that is not automated. Departmental page. Departmental dashboard.Contracts/ budgets. To keep employees up to date on local progress. Project page.
The text above is only a small portion of this article. Become a StrategyDriven Premium Member to gain access to the entire article and the over 100 StrategyDriven members-only articles, whitepapers, models, and tools and templates. Please consider the environment before and after printing this article.
We organize all of the trending information in your field so you don't have to. Join 49,000+ users and stay up to date on the latest articles your peers are reading.
You know about us, now we want to get to know you!
Let's personalize your content
Let's get even more personalized
We recognize your account from another site in our network, please click 'Send Email' below to continue with verifying your account and setting a password.


Let's personalize your content