This site uses cookies to improve your experience. To help us insure we adhere to various privacy regulations, please select your country/region of residence. If you do not select a country, we will assume you are from the United States. Select your Cookie Settings or view our Privacy Policy and Terms of Use.
Cookie Settings
Cookies and similar technologies are used on this website for proper function of the website, for tracking performance analytics and for marketing purposes. We and some of our third-party providers may use cookie data for various purposes. Please review the cookie settings below and choose your preference.
Used for the proper function of the website
Used for monitoring website traffic and interactions
Cookie Settings
Cookies and similar technologies are used on this website for proper function of the website, for tracking performance analytics and for marketing purposes. We and some of our third-party providers may use cookie data for various purposes. Please review the cookie settings below and choose your preference.
Strictly Necessary: Used for the proper function of the website
Performance/Analytics: Used for monitoring website traffic and interactions
Beyond breaking down silos, modern data architectures need to provide interfaces that make it easy for users to consume data using tools fit for their jobs. Shared data assets, such as product catalogs, fiscal calendar dimensions, and KPI definitions, require a common vocabulary to help avoid disputes during analysis. Curate the data.
And the Global AI Assessment (AIA) 2024 report from Kearney found that only 4% of the 1,000-plus executives it surveyed would qualify as leaders in AI and analytics. I dont think anyone has any excuses going into 2025 not knowing broadly what these tools can do for them, Mason adds. What ROI will AI deliver?
Aligning KPIs to key digital objectives CIOs should look for meaningful business metrics that employees can understand — and establish practical tools for measuring them. Improving this KPI means teams can experiment faster, personalize experiences, and increase revenue from software-enabled products and services.
Power BI is Microsoft’s interactive data visualization and analyticstool for business intelligence (BI). You can also use Power BI to prepare and manage high-quality data to use across the business in other tools, from low-code apps to machine learning.
Without visualized analytics, it was difficult to bridge the void between expectation and accurate analysis. Yet, as complicated as this sounded, the tools were in place to accomplish this in a stunning amount of time. Even as the Huabao Group expanded, its digitization effort lagged.
potential talent is becoming much more “efficient” in many firms, top talent is becoming simultaneously more expensive and more easily lost to competitors,” stresses professor of workforce analytics Mark Huselid in The science and practice of workforce analytics: Introduction to the HRM special issue. . What is people and HR analytics?
This includes spending on strengthening cybersecurity (35%), improving customer service (32%) and improving data analytics for real-time business intelligence and customer insight (30%). And it’s not just applications development where such tools are having an impact.
After putting in place the right data infrastructure and governance for ESG reporting, ensuring the enterprise has the right ESG reporting tools in place is critical. It made sense to make use of a tool in that landscape that will be more easily adopted.
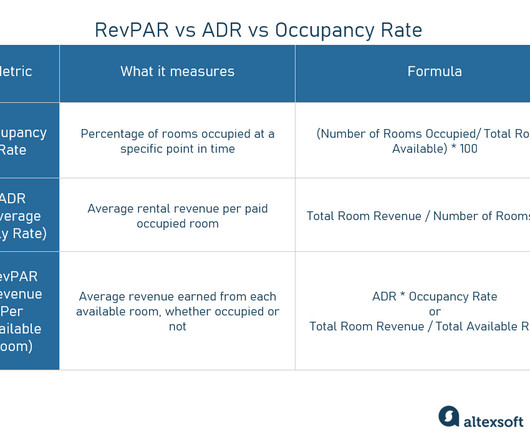
Revenue Per Available Room, or RevPAR, has emerged as a crucial key performance indicator (KPI) for assessing a hotel’s financial well-being and prosperity. To obtain this data, consider available industry benchmarking and analytics services. This outcome suggests that your hotel obtained a larger market share than expected.
AI-driven network security management tools accelerate incident response by automating the process of identifying, containing, and mitigating threats. Improved Threat Detection AI-powered network security monitoring tools are particularly effective at spotting subtle threats that traditional methods might miss.
Today, the biggest issue with metrics is not how to measure them – Google Analytics alone is a valuable tool for calculating and visualizing your success. It’s an effective KPI to use to monitor a company’s current health and it’s especially valuable in SaaS businesses working on a subscription basis. How to use MRR and ARPU.
In this article, we’ll explain what procurement analytics is, highlight the main difficulties within the purchasing process, and look at how analytics can address them. What is procurement analytics and the opportunities it offers? Main components of procurement analytics. Procurement and its challenges.
Analytics creates Extra Power for your Software Development Organization?—?Part They impact negatively on the budget but many of them can be remedied through software analytics. It’s worth noting that some form of analytics is required in order to be able to do so. The loss corresponds to 2.5 team members ? developers ?
We also investigate predicting ADR through machine learning and strategies to enhance this KPI. Unlike the other metrics, ADR focuses solely on revenue from actual room sales, making it a vital KPI of a hotel’s pricing strategy effectiveness. As one of the analytical pillars, ADR provides a clear view of revenue performance.
It can be hard to quantify via KPI (there are methods, but that is not the topic of this blog), but the goal is not to sell a product today. Tools and Technologies for Leveraging Micro-Moments Data Analytics : Track customer behavior to identify high-impact micro-moments.
With this in mind, we will dive into what KPIs are, their common misconceptions, and the characteristics of effective KPIs. KPIs: A Performance Measurement ToolKPIs are a performance measurement tool used to track progress towards a specific goal or objective.
This is a guest post co-written with Vicente Cruz Mínguez, Head of Data and Advanced Analytics at Cepsa Química, and Marcos Fernández Díaz, Senior Data Scientist at Keepler. About the authors Vicente Cruz Mínguez is the Head of Data & Advanced Analytics at Cepsa Química. However, a manual process is time-consuming and not scalable.
Integration: Optimizely Experimentation integrates with a wide range of tools, including Google products, while Google Optimize is primarily designed to work with Google Analytics. It enables you to run every type of experiment, create customized experiences, target specific messages, and make recommendations.
The goal of business intelligence (BI) and analyticstools is to enable smarter, data-driven decisions by converting raw data into meaningful visual and text representations. In this article, we’ll talk about some of the most powerful BI and analyticstools that you have on hand: reporting, dashboards and scorecards.
The 11th annual survey of Chief Data Officers (CDOs) and Chief Data and Analytics Officers reveals 82 percent of organizations are planning to increase their investments in data modernization in 2023. machine learning and deep learning models; and business intelligence tools.
In this lengthy article, you’ll discover the top 30 agile project management tools to help you manage your projects effectively and increase your team performance swiftly. You can explore the tool without paying a dime and see if it’s the perfect fit for you. NOTE: You can rest assured that everything is up to date for 2020.
Many organizations are implementing KPI or objectives and key results (OKRs) that encourage teams to think about business value and strategic outcomes in their daily work. When used correctly, KPIs and OKRs are valuable tools for data-driven development.
It uses the tools that allow a property to sell all the inventory by keeping customer flow steady and attracting new guests. KPI tracking. The last point is of special importance, because the KPIs define the success of the whole strategy. KPIs in hotel revenue management. Let’s look at the most popular tools.
By adopting such in-depth monitoring, organizations can leverage real-time data on reporting and analytics to gain valuable insights for success. Why do we need a Business Activity Monitoring Tool? Overcome Business Hurdles : With BAM tools, businesses gain control over their operations through the monitoring of dynamic reports.
This article will explore top tools for task management, roadmapping, OKRs, and mind maps. Whether teams are co-located or remote, product management tools facilitate teamwork and alignment with real-time collaboration features. Your decision should be guided by both personal preferences and business requirements.
In a digital world, to manage these processes in both ways, businesses use logistics management systems – a combination of software tools that optimize all processes between making an order and delivering it to a customer’s door. To decide on the cheapest carrier, there’re transportation procurement tools.
More than 6,000 accounts are estimated to have installed the tool but never used it, with thousands of others conducting just 1 test before shelving it. The Complexity Factor The plain fact is many optimization tools “for marketing” were not truly designed for ease of use by marketers.
That happens best when DevOps tools offer operational data and Key Performance Indicators (KPIs) to help businesses make better decisions and respond to the market faster. Focus on Analytics. Focusing on analytics provides a more holistic and comprehensive approach to DevOps. Continuous Monitoring and Feedback.
He starts with browsing the available tables in the Data Catalog tool in CDP. Jon concludes that the old customer dashboard needs to be augmented with this new data set, and then sets out with the idea to build a Customer Insight application using the out-of-the-box, easy-to-use visualization tool in CDP: Data Visualization.
Portability non-functional requirements are usually based on preliminary market research, field research activities, or analytics reports on which types of software and devices the target audience has. Infer portability requirements from your analyticstools if you can. How to approach. Specify the component that you describe.
We live in the age of analytics, powered by incredible advances in distributed computing and big data technology. Companies are turning to data and analytics to improve all aspects of how they do business. KPI data from network elements and monitoring probes. Server, OS, VM and container instrumentation.
Enter the Power BI Purchase Dashboard: a powerful analyticstool allowing organizations real-time insights into their procurement activities, supplier performance, spending habits, and more. Spend Analysis Dashboard A Spend Analysis Dashboard is a tool used by businesses to analyze and monitor their spending patterns and expenses.
Although there are key differences between these two, which we’ve explained in our infographic on Agile approaches , both have numerous applications and tools to simplify a project manager’s job. Project Manager’s KPI – Tracking improvement over time. Strong analytical skills is one of the basics for a product manager.
Despite its simplicity, the occupancy rate is an important KPI that shows how full your hotel is. Revenue managers have to focus on this KPI to develop the revenue potential of all hotel departments and adjust the package offers and the entire upselling strategy. The CPOR is a crucial KPI that allows you to monitor your expenses.
Closely linked to Power BI, Power BI analytics is the most powerful and efficient tool that enables you to not only view data but also uncover trends, identify opportunities, and model your organization to become more effective and successful. For most organizations, these key metrics can be divided into three broad categories.
With today’s modern analytictools, enterprises are now able to quantify business productivity, gains or losses, much more succinctly. As far back as I can remember, a good “rule of thumb” to determine business productivity was to divide the number of employees by the annual revenue. Any resultant between $.5M
If you are using a system like Hootsuite, many of the KPI tracking tools that you need are already incorporated into the system. There are systems that you can install, like Google Analytics, that only focus on collecting performance data and are powerful tools for improving marketing performance.
It ensures seamless communication between the cloud and the user by providing real-time analytics for cloud computing. Perform continuous monitoring and testing: You need to track KPI (Key Performance Indicators) and system security. You can migrate the time-consuming process first to speed up the process.
Process mining and analytics can take advantage of event logs and process data to find the nuggets of knowledge on which informed decision-making and smart new ventures are based. That’s why today we use process mining and analytics instead. Organizational culture has a major role to play too.
While technologies such as AI and tools like advanced analytics have matured over time to help businesses leverage these massive data sets, organizations are not utilizing these to create a competitive advantage. Apart from technology and tools, a change in the organization’s culture is crucial. We live in an era of information.
In fact, these tools hold the potential to accelerate entire enterprises – if they can free their minds from outdated philosophies and methods. An intimacy model has moved from “nice to have” to a “must have” KPI in a product’s acceptance, usage, and effectiveness throughout its lifecycle. Consumers are demanding more, faster.
They also have the capability to generate reports and analytics, which helps in decision-making across diverse platforms. They offer independent approvals, flow management, reminders, personalized alerts, and time-outs, with KPI dashboards and reports for tracking success.
Data leakages in reporting and analytics activities. Some of the important KPI categories that have to be monitored are. Financial and reporting modules: supporting billing and analytics. Crane analytics dashboard in Navis N4. Terminal operators need to have full visibility into all facility activities.
In this article, we will explore the benefits of continuous performance testing for mobile apps, highlight tools for continuous performance testing, and see how you can add performance testing to your CI pipeline. This tool lets users use real browsers instead of load emulators. What is performance testing?
We organize all of the trending information in your field so you don't have to. Join 49,000+ users and stay up to date on the latest articles your peers are reading.
You know about us, now we want to get to know you!
Let's personalize your content
Let's get even more personalized
We recognize your account from another site in our network, please click 'Send Email' below to continue with verifying your account and setting a password.


Let's personalize your content