This site uses cookies to improve your experience. To help us insure we adhere to various privacy regulations, please select your country/region of residence. If you do not select a country, we will assume you are from the United States. Select your Cookie Settings or view our Privacy Policy and Terms of Use.
Cookie Settings
Cookies and similar technologies are used on this website for proper function of the website, for tracking performance analytics and for marketing purposes. We and some of our third-party providers may use cookie data for various purposes. Please review the cookie settings below and choose your preference.
Used for the proper function of the website
Used for monitoring website traffic and interactions
Cookie Settings
Cookies and similar technologies are used on this website for proper function of the website, for tracking performance analytics and for marketing purposes. We and some of our third-party providers may use cookie data for various purposes. Please review the cookie settings below and choose your preference.
Strictly Necessary: Used for the proper function of the website
Performance/Analytics: Used for monitoring website traffic and interactions
And the Global AI Assessment (AIA) 2024 report from Kearney found that only 4% of the 1,000-plus executives it surveyed would qualify as leaders in AI and analytics. To counter such statistics, CIOs say they and their C-suite colleagues are devising more thoughtful strategies. As part of that, theyre asking tough questions about their plans.
Regardless of where organizations are in their digital transformation, CIOs must provide their board of directors, executive committees, and employees definitions of successful outcomes and measurable key performance indicators (KPIs). Do a little research, and you’ll find many frameworks, taxonomies, and recommendations for digital KPIs.
To deliver the most value, encourage your return and loyalty, executives of companies like these start their weeks with looking at metrics – pieces of quantifiable data that illustrate the changes in revenue and customer behavior. In this article, we will introduce you to metrics and KPIs to track your product success.
Power BI is Microsoft’s interactive data visualization and analytics tool for business intelligence (BI). With Power BI, you can pull data from almost any data source and create dashboards that track the metrics you care about the most. Power BI’s rich reports or dashboards can be embedded into reporting portals you already use.
“We removed some in-the-weeds data about growth loop conversion metrics,” the team told me, “along with sales cycle/revenue traction.” Vori-at-a-glance — (KPI slide, lightly redacted). Vori shared 13 slides, redacting a little bit of information. ” Cover slide. Mission statement slide.
PwC provides guidance on data integration, along with best practices for KPI calculation, enabling customers to harmonize information and to build up a single source of truth. SAP SCT’s features include pre-built data models containing metrics that can be customized or even created from scratch.
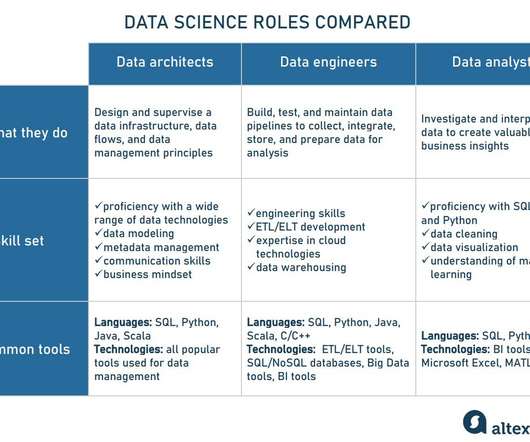
potential talent is becoming much more “efficient” in many firms, top talent is becoming simultaneously more expensive and more easily lost to competitors,” stresses professor of workforce analytics Mark Huselid in The science and practice of workforce analytics: Introduction to the HRM special issue. . What is people and HR analytics?
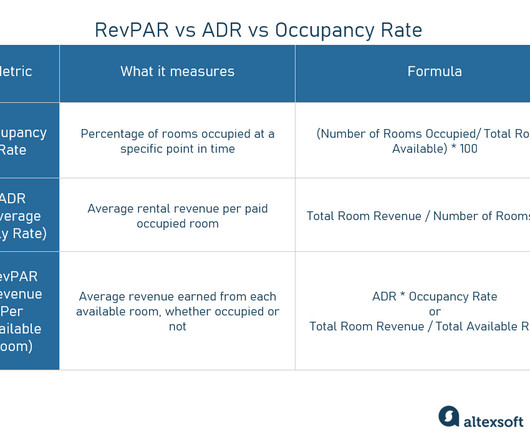
Revenue Per Available Room, or RevPAR, has emerged as a crucial key performance indicator (KPI) for assessing a hotel’s financial well-being and prosperity. This significant metric enables hotel owners to evaluate their property’s performance by considering both occupancy rates and average daily rates (ADR).
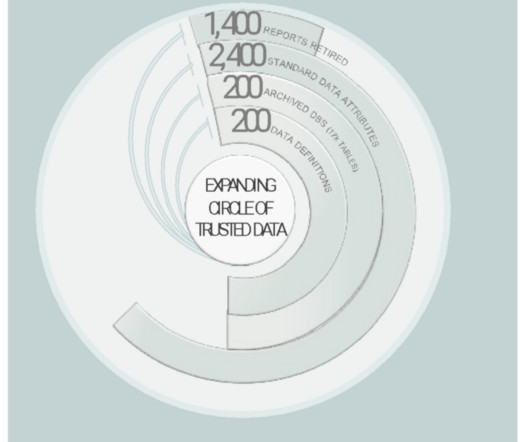
Start with critical data elements, those data objects comprising the most important metrics and KPI to run the company. By sourcing new analytics from standard datasets, archiving legacy datasets, and repiping established analytics ( only when feasible and purposeful! ), we increase trust in data.
In other words, a certain number of metrics and KPIs has to be set up, monitored, and analyzed to be turned into valuable insights. Occupancy rate, ADR, and ALOS: basic operational metrics. Despite its simplicity, the occupancy rate is an important KPI that shows how full your hotel is. Occupancy rate. What does it show?
Here at Apps Associates, we have implemented Oracle Fusion Analytics numerous times and have worked and are working with many other clients who are evaluating Fusion Analytics. What is included with Oracle Fusion Analytics (FA)? What is included with Oracle Fusion Analytics (FA)?
It can be hard to quantify via KPI (there are methods, but that is not the topic of this blog), but the goal is not to sell a product today. Tools and Technologies for Leveraging Micro-Moments Data Analytics : Track customer behavior to identify high-impact micro-moments. Build metrics around micro-moments and methods of tracking them.
In this article, we’ll explain what procurement analytics is, highlight the main difficulties within the purchasing process, and look at how analytics can address them. What is procurement analytics and the opportunities it offers? Main components of procurement analytics. Procurement and its challenges.
We also investigate predicting ADR through machine learning and strategies to enhance this KPI. It is a hotel performance metric representing the average revenue earned for each room rented out in a hotel over a certain period. The metric includes all types of rooms and rates, whether discounted, group, or the best available ones.
Align everything to corporate strategy I lead data and analytics at Cloudera. We’re called Cloudera Data Analytics (CDA). Prior to forming the group, it was imperative to understand Cloudera’s corporate strategy: corporate objectives, product strategy, go-to-market strategy, key metrics and KPI. How very clever.
Many organizations are implementing KPI or objectives and key results (OKRs) that encourage teams to think about business value and strategic outcomes in their daily work. When used correctly, KPIs and OKRs are valuable tools for data-driven development. Engineering metrics. Positive behavioral metrics.
As businesses strive to measure and track their performance, Key Performance Indicators (KPIs) have become increasingly popular in recent years. However, developing effective KPIs is not as simple as choosing a few metrics to monitor. Therefore, businesses must pick metrics that align with their objectives and strategic goals.
Use Predictive Analytics : Analyze historical attack data to anticipate potential future threats. Behavioral Analytics : Detecting deviations in user behavior that could indicate insider threats. Trending Metrics: Track KPI progress over time to evaluate whether your management practices are driving improvement.
This is a guest post co-written with Vicente Cruz Mínguez, Head of Data and Advanced Analytics at Cepsa Química, and Marcos Fernández Díaz, Senior Data Scientist at Keepler. About the authors Vicente Cruz Mínguez is the Head of Data & Advanced Analytics at Cepsa Química. However, a manual process is time-consuming and not scalable.
Following best practices for KPIs (key performance indicators) is an essential start for any marketing initiative, but it’s often an overlooked step. Let’s look and why KPIs are so important and some practical advice that can help you incorporate, and get value from, your KPIs. What is a KPI?
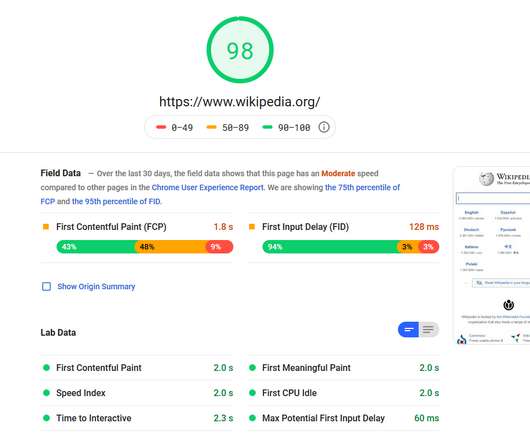
In most cases, this metric explains how much a user must wait before the target operation happens (the page renders, a transaction gets processed, etc.) Jakob Nielsen back in 1993 has outlined 3 main metrics for a response time. Does your metric include browser rendering or only the time it takes to deliver data to a browser?
What gives data meaning is analytics – which in turn can shape business operations, thereby giving organizations a clear competitive advantage. What they need is an automated, digital data system that automatically collects, organizes, and analyzes data, using appropriate metrics. A jumble of everything and nothing.
To make their planning more organized, a project manager creates process documentation – a set of standards, reports, metrics, schedules the team should adhere to during development. The success of a product manager is estimated via quantified data of product success metrics throughout its life cycle. Pirate metrics.
The goal of business intelligence (BI) and analytics tools is to enable smarter, data-driven decisions by converting raw data into meaningful visual and text representations. In this article, we’ll talk about some of the most powerful BI and analytics tools that you have on hand: reporting, dashboards and scorecards.
KPI tracking. The last point is of special importance, because the KPIs define the success of the whole strategy. KPIs in hotel revenue management. It’s compared to hotel’s historical ADR or competitors’ metrics. Revenue per available room (RevPAR) – a KPI that assess financial and business performance of a hotel.
In a previous blog of this series, Turning Streams Into Data Products , we talked about the increased need for reducing the latency between data generation/ingestion and producing analytical results and insights from this data. Building real-time streaming analytics data pipelines requires the ability to process data in the stream.
Closely linked to Power BI, Power BI analytics is the most powerful and efficient tool that enables you to not only view data but also uncover trends, identify opportunities, and model your organization to become more effective and successful. For most organizations, these key metrics can be divided into three broad categories.
Enter the Power BI Purchase Dashboard: a powerful analytics tool allowing organizations real-time insights into their procurement activities, supplier performance, spending habits, and more. Improving Business Growth with Power BI A bicycle manufacturing company aimed to enhance its business operations through data analytics.
The 11th annual survey of Chief Data Officers (CDOs) and Chief Data and Analytics Officers reveals 82 percent of organizations are planning to increase their investments in data modernization in 2023. They also define KPIs to measure and track the performance of the entire data infrastructure and its separate components.
This is an important metric to track as it will help you to understand the productivity of your team. With the sales cycle length metric, you can identify any issues that might be causing a delay. This metric will show you how many leads are ready to purchase and how many are progressing towards the sales cycle. Close Ratio.
Core Features of Power BI for Supply Chain Analytics From seamless data connectivity to intuitive visualization capabilities and seamless integration with other Microsoft products, Power BI emerges as a vital asset in optimizing supply chain operations. Here’s an in-depth look at three common types of supply chain dashboards: 1.
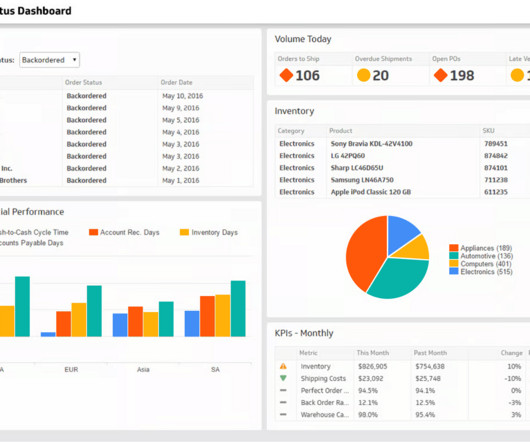
By adopting such in-depth monitoring, organizations can leverage real-time data on reporting and analytics to gain valuable insights for success. The flexibility of customizable dashboards and reporting options allows businesses to focus on the metrics that matter most to their specific needs. What is Business Activity Monitoring?
We live in the age of analytics, powered by incredible advances in distributed computing and big data technology. Companies are turning to data and analytics to improve all aspects of how they do business. KPI data from network elements and monitoring probes. Application performance metrics.
If you are using a system like Hootsuite, many of the KPI tracking tools that you need are already incorporated into the system. It can track individual metrics or develop reports on a wide array of metrics that you need to follow. You want to keep your conversion rate above 1%, which is the average for digital marketing. .
Delivery estimation is based on such critical parameters as population density, vehicle type, and capacity, predictive traffic analytics, etc. Logistics analytics. Applying Business Intelligence, the software can develop performance metrics and KPIs, and create computer models to predict supply chain issues.
With today’s modern analytic tools, enterprises are now able to quantify business productivity, gains or losses, much more succinctly. The enterprises interviewed reported significant improvements across a number of performance metrics. Any resultant between $.5M 5M to $1M was deemed a productive environment.
Most API analytics dashboards focus exclusively on the technical performance of APIs at the expense of metrics focused on the business value of your program. Unlock Business Insights with a Consolidated Analytics Dashboard. However, can you accurately measure the impact of your API program on your business?
miles long carrying 82,000 metric tons of ore), and more sustainable (one ton of freight can be moved over 470 miles on just a single gallon of diesel fuel). If you’re a shipper or carrier that was charged, well, the payment is inevitable, but you still need to keep records in case any disputes arise (and for analytical purposes too).
Acceptance of a new or upgraded performance monitoring system centers on metric and report accuracy. Processes from which metric and report data is sourced are not rigorously followed. Ongoing maintenance/development of metrics and reports are highly reliant on the knowledge and skills of a single individual.
Stakeholders — from property owners to managers to housekeeping staff — use this metric to make informed decisions and increase revenue per room or property. While occupancy rate is essential for deciding whether your management strategies succeed or fail, there are a few things you should keep in mind regarding this KPI.
WMS offers numerous opportunities to track and generate reports concerning every side of your business: Customizable metrics would let you assess all the data and know your most profitable customer, top-selling product, best-performing sales channel, most efficient worker, peak sales season, etc. Setting material handling policies.
Moreover, technology and analytics have enabled professionals in all fields to process a tidal wave of data and present it in informational and easy-to-understand reports. While MSPs and internal IT can track hundreds of metrics, keeping tabs on all of them is time-consuming and labor-intensive. Besides, not all metrics provide value.
In the manufacturing industry’s competitive landscape, excelling in the digital era involves more than quality products; it’s also about leveraging your data and using it for data analytics, online analytical processing. It allows users to delve into metrics, apply filters, and interact to gain insights.
Using ML (machine learning), advanced conversational analytics, and NLP (natural language processing), AI in the banking industry has reshaped the customer journey. Analytics & Data Insights By processing huge volumes of data from customer interactions, conversational AI enables invaluable insights unavailable so far.
We organize all of the trending information in your field so you don't have to. Join 49,000+ users and stay up to date on the latest articles your peers are reading.
You know about us, now we want to get to know you!
Let's personalize your content
Let's get even more personalized
We recognize your account from another site in our network, please click 'Send Email' below to continue with verifying your account and setting a password.


Let's personalize your content