This site uses cookies to improve your experience. To help us insure we adhere to various privacy regulations, please select your country/region of residence. If you do not select a country, we will assume you are from the United States. Select your Cookie Settings or view our Privacy Policy and Terms of Use.
Cookie Settings
Cookies and similar technologies are used on this website for proper function of the website, for tracking performance analytics and for marketing purposes. We and some of our third-party providers may use cookie data for various purposes. Please review the cookie settings below and choose your preference.
Used for the proper function of the website
Used for monitoring website traffic and interactions
Cookie Settings
Cookies and similar technologies are used on this website for proper function of the website, for tracking performance analytics and for marketing purposes. We and some of our third-party providers may use cookie data for various purposes. Please review the cookie settings below and choose your preference.
Strictly Necessary: Used for the proper function of the website
Performance/Analytics: Used for monitoring website traffic and interactions
Shared data assets, such as product catalogs, fiscal calendar dimensions, and KPI definitions, require a common vocabulary to help avoid disputes during analysis. Real-time analytics. Establish a common vocabulary. Curate the data.
Key performance indicator, or KPI, […]. The post 5 Ways KPI Analysis Helps DevOps appeared first on DevOps.com. However, variety and veracity often determine success or failure, and they tend to sneak up on teams who haven’t fully considered them.
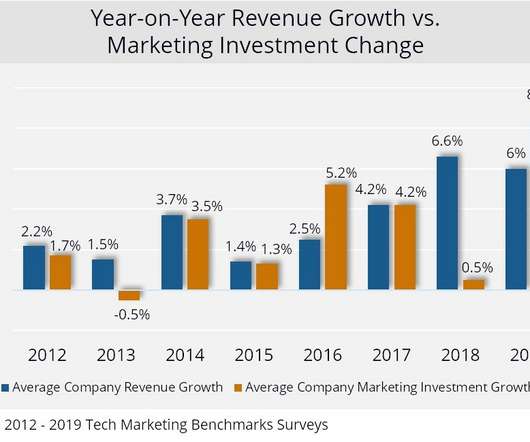
And the Global AI Assessment (AIA) 2024 report from Kearney found that only 4% of the 1,000-plus executives it surveyed would qualify as leaders in AI and analytics. To counter such statistics, CIOs say they and their C-suite colleagues are devising more thoughtful strategies. As part of that, theyre asking tough questions about their plans.
The portfolio of digital transformation initiatives often includes programs targeting growth, efficiencies, and improved end-user experiences, but adequate evaluation of outcomes requires program leaders to select KPIs specific to each initiative. As a result, outcome-based metrics should be your guide.
To date the company has moved 5,000 applications to Microsoft Azure as it applies predictive analytics , AI, robotics, and process automation in many of its business operations. The company is also refining its data analytics operations, and it is deploying advanced manufacturing using IoT devices, as well as AI-enhanced robotics.
Vori-at-a-glance — (KPI slide, lightly redacted). The cover slide is at the top of this post and just reads “The OS for Grocery” with a few keywords, designed as tags (“order management,” “inventory management” and “analytics”). ” Cover slide. Mission statement slide.
potential talent is becoming much more “efficient” in many firms, top talent is becoming simultaneously more expensive and more easily lost to competitors,” stresses professor of workforce analytics Mark Huselid in The science and practice of workforce analytics: Introduction to the HRM special issue. . What is people and HR analytics?
Without visualized analytics, it was difficult to bridge the void between expectation and accurate analysis. Along with Arobot, SAP Sales Cloud, SAP Analytics Cloud, and SAP Business Planning and Consolidation (BPC) would be among the solutions used to create a platform that would set new industry standards for technological innovation.
Power BI is Microsoft’s interactive data visualization and analytics tool for business intelligence (BI). You can also use Frontline’s Analytic Solver to turn Excel analytics models into custom Power BI visualizations without having to design the custom visual in JavaScript.
In some instances, poor implementation and faulty configurations were the culprits for deteriorating ROI, TCO and KPI values. Or perhaps you choose to offload an analytics application to the public cloud for rapid scalability during peak traffic cycles. And maybe you need to move an app to the edge for speedier data retrieval.
PwC provides guidance on data integration, along with best practices for KPI calculation, enabling customers to harmonize information and to build up a single source of truth. PwC empowers its customers to achieve successful CSRD reporting by offering a comprehensive understanding of the underlying CSRD methodology.
This includes spending on strengthening cybersecurity (35%), improving customer service (32%) and improving data analytics for real-time business intelligence and customer insight (30%). Fifty-two percent of organizations plan to increase or maintain their IT spending this year, according to Enterprise Strategy Group.
Su director de data & analytics, José Carlos Bermejo, explica a este medio que gran parte de las utilidades de esta tecnología se deben a la correcta estrategia en torno al dato. José Carlos Bermejo, director de data & analytics de Air Europa. Por lo que debemos, a su vez, monitorizar su utilización mediante diferentes KPI”.
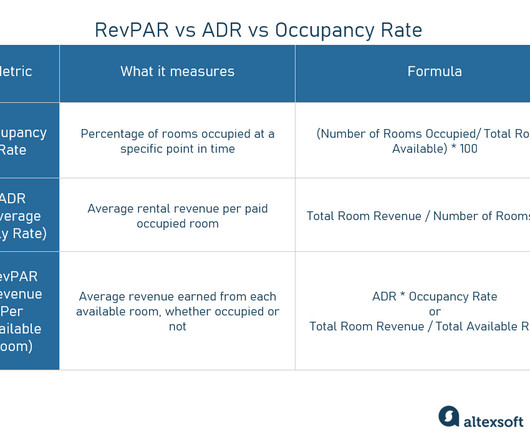
Revenue Per Available Room, or RevPAR, has emerged as a crucial key performance indicator (KPI) for assessing a hotel’s financial well-being and prosperity. To obtain this data, consider available industry benchmarking and analytics services. This outcome suggests that your hotel obtained a larger market share than expected.
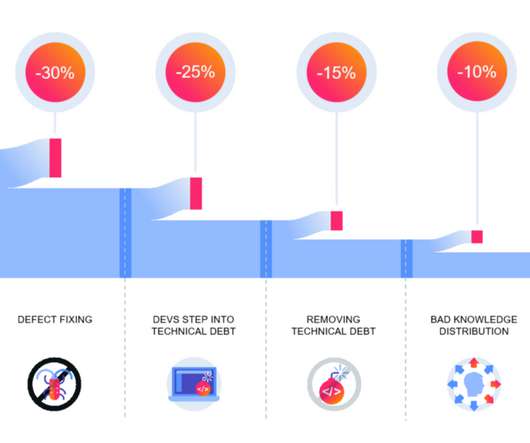
Analytics creates Extra Power for your Software Development Organization?—?Part In a series of articles, we examine the software development process with all its flavors (waterfall vs. agile; projects vs. products; …) and show you how analytics methods can help you to better monitor, steer and optimize your software development organization.
Today, the biggest issue with metrics is not how to measure them – Google Analytics alone is a valuable tool for calculating and visualizing your success. It’s an effective KPI to use to monitor a company’s current health and it’s especially valuable in SaaS businesses working on a subscription basis. How to use MRR and ARPU.
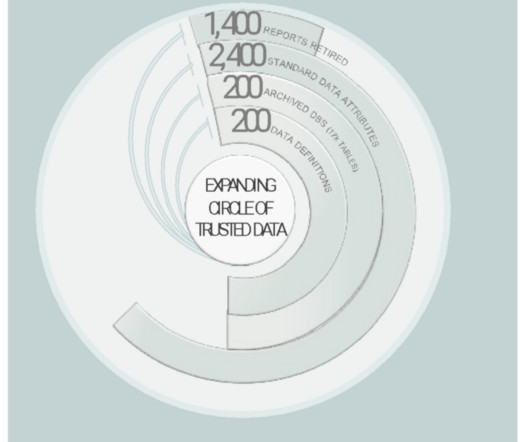
Start with critical data elements, those data objects comprising the most important metrics and KPI to run the company. By sourcing new analytics from standard datasets, archiving legacy datasets, and repiping established analytics ( only when feasible and purposeful! ), we increase trust in data.
Here at Apps Associates, we have implemented Oracle Fusion Analytics numerous times and have worked and are working with many other clients who are evaluating Fusion Analytics. What is included with Oracle Fusion Analytics (FA)? What is included with Oracle Fusion Analytics (FA)?
Analytics creates Extra Power for your Software Development Organization?—?Part They impact negatively on the budget but many of them can be remedied through software analytics. It’s worth noting that some form of analytics is required in order to be able to do so. The loss corresponds to 2.5 team members ? developers ?
In this article, we’ll explain what procurement analytics is, highlight the main difficulties within the purchasing process, and look at how analytics can address them. What is procurement analytics and the opportunities it offers? Main components of procurement analytics. Procurement and its challenges.
That’s right — with more data available, operations teams can expand KPI visibility to their workers, and with it some creative incentives. Consider the analytics we're all exposed to in sports. But how about talent? What’s a little friendly competition among order pickers?
For large organizations, the end-to-end data and technology solution will include your ERPs, data and analytics landscape, certainly AI, low- and no-code platforms, and a range of emerging tech.” “Applying concepts of solution architecture to truly solve the problem end to end is not really negotiable,” she says.
If you set up your tracking correctly, most online advertising (for example, Google Ads, Facebook Ads) and analytics platforms (for example, Google Analytics) can show you your conversion rate. . This means there’s a good chance your previously high-converting web pages are now languishing at the bottom of your analytics report. .
We also investigate predicting ADR through machine learning and strategies to enhance this KPI. Unlike the other metrics, ADR focuses solely on revenue from actual room sales, making it a vital KPI of a hotel’s pricing strategy effectiveness. As one of the analytical pillars, ADR provides a clear view of revenue performance.
Align everything to corporate strategy I lead data and analytics at Cloudera. We’re called Cloudera Data Analytics (CDA). Prior to forming the group, it was imperative to understand Cloudera’s corporate strategy: corporate objectives, product strategy, go-to-market strategy, key metrics and KPI. How very clever. And now I know.
La piattaforma poggia su un data lake in public cloud, su cui si innestano le tecnologie martech (ovvero i software per le attività di marketing) e gli analytics che, partendo dai dati, portano a un’azione funzionale agli obiettivi di business. “Il
Last year we announced that we’re working with the Wi-Fi Alliance to develop a standard for Key Performance Indicator (KPI) capture in a Wi-Fi network—now officially called Wi-Fi CERTIFIED Data Elements. The Ins and Outs of Wi-Fi CERTIFIED Data Elements. Setting Up the Platform.
Use Predictive Analytics : Analyze historical attack data to anticipate potential future threats. Behavioral Analytics : Detecting deviations in user behavior that could indicate insider threats. Trending Metrics: Track KPI progress over time to evaluate whether your management practices are driving improvement.
Following best practices for KPIs (key performance indicators) is an essential start for any marketing initiative, but it’s often an overlooked step. Let’s look and why KPIs are so important and some practical advice that can help you incorporate, and get value from, your KPIs. What is a KPI?
Il nuovo ruolo dell’IT: la business continuity Deligia ha costruito la sua strategia per la business continuity sulle fondamenta tecnologiche di big data , analytics, automazione e IA. L’IT è stato diviso in tre parti: il core banking, l’infrastruttura informatica, e la parte di gestione dati, analytics e intelligenza artificiale.
This is a guest post co-written with Vicente Cruz Mínguez, Head of Data and Advanced Analytics at Cepsa Química, and Marcos Fernández Díaz, Senior Data Scientist at Keepler. About the authors Vicente Cruz Mínguez is the Head of Data & Advanced Analytics at Cepsa Química. However, a manual process is time-consuming and not scalable.
When businesses select actionable KPIs and monitor them in real-time, they can take swift corrective actions and improve productivity. Avoiding KPI Overload Lastly, businesses must avoid having too many KPIs, which may dilute focus and effectiveness. Avoiding KPI overload ensures a more focused and impactful approach.
It can be hard to quantify via KPI (there are methods, but that is not the topic of this blog), but the goal is not to sell a product today. Tools and Technologies for Leveraging Micro-Moments Data Analytics : Track customer behavior to identify high-impact micro-moments. Build metrics around micro-moments and methods of tracking them.
In a previous blog of this series, Turning Streams Into Data Products , we talked about the increased need for reducing the latency between data generation/ingestion and producing analytical results and insights from this data. Building real-time streaming analytics data pipelines requires the ability to process data in the stream.
Tutti vogliono l’AI, ma per investire occorrono nuovi KPI BearingPoint sottolinea non solo l’assenza di una chiara governance dell’AI, ma anche che appena il 34% delle aziende basa sistematicamente le proprie decisioni di investimento su metriche misurabili.
Integration: Optimizely Experimentation integrates with a wide range of tools, including Google products, while Google Optimize is primarily designed to work with Google Analytics. It enables you to run every type of experiment, create customized experiences, target specific messages, and make recommendations.
Many organizations are implementing KPI or objectives and key results (OKRs) that encourage teams to think about business value and strategic outcomes in their daily work. When used correctly, KPIs and OKRs are valuable tools for data-driven development. “The
KPI tracking. The last point is of special importance, because the KPIs define the success of the whole strategy. KPIs in hotel revenue management. Revenue per available room (RevPAR) – a KPI that assess financial and business performance of a hotel. This KPI captures a snapshot of overall business performance.
What gives data meaning is analytics – which in turn can shape business operations, thereby giving organizations a clear competitive advantage. What’s needed is a self-service analytics platform with best-in-class metrics that transforms data into actionable business insights based on historical trends and predictive models.
The goal of business intelligence (BI) and analytics tools is to enable smarter, data-driven decisions by converting raw data into meaningful visual and text representations. In this article, we’ll talk about some of the most powerful BI and analytics tools that you have on hand: reporting, dashboards and scorecards.
The Data Driven Insights project, a first for policing in the UK, is a cutting edge initiative to radically improve the Force’s data and analytics capabilities. With Cloudera at its core, we’ve been able to deliver real benefits including: Crimes Visual Analytics Apps. ML to Enhance Crime Detection and Response.
However, beneath the placid surface of this stable KPI, the nature of how marketers build demand is changing significantly. From thought leadership to analytics, learn how to supercharge your marketing activities to produce relevant, high-quality content that converts.
The 11th annual survey of Chief Data Officers (CDOs) and Chief Data and Analytics Officers reveals 82 percent of organizations are planning to increase their investments in data modernization in 2023. They also define KPIs to measure and track the performance of the entire data infrastructure and its separate components.
Portability non-functional requirements are usually based on preliminary market research, field research activities, or analytics reports on which types of software and devices the target audience has. Infer portability requirements from your analytics tools if you can. How to approach. Specify the component that you describe.
We organize all of the trending information in your field so you don't have to. Join 49,000+ users and stay up to date on the latest articles your peers are reading.
You know about us, now we want to get to know you!
Let's personalize your content
Let's get even more personalized
We recognize your account from another site in our network, please click 'Send Email' below to continue with verifying your account and setting a password.


Let's personalize your content