This site uses cookies to improve your experience. To help us insure we adhere to various privacy regulations, please select your country/region of residence. If you do not select a country, we will assume you are from the United States. Select your Cookie Settings or view our Privacy Policy and Terms of Use.
Cookie Settings
Cookies and similar technologies are used on this website for proper function of the website, for tracking performance analytics and for marketing purposes. We and some of our third-party providers may use cookie data for various purposes. Please review the cookie settings below and choose your preference.
Used for the proper function of the website
Used for monitoring website traffic and interactions
Cookie Settings
Cookies and similar technologies are used on this website for proper function of the website, for tracking performance analytics and for marketing purposes. We and some of our third-party providers may use cookie data for various purposes. Please review the cookie settings below and choose your preference.
Strictly Necessary: Used for the proper function of the website
Performance/Analytics: Used for monitoring website traffic and interactions
Enter Gen AI, a transformative force reshaping digital experience analytics (DXA). Gen AI as a catalyst for actionable insights One of the biggest challenges in digital analytics isn’t just understanding what’s happening, but why it’s happening—and doing so at scale, and quickly. That’s where Gen AI comes in.
This article is the first in a multi-part series sharing a breadth of Analytics Engineering work at Netflix, recently presented as part of our annual internal Analytics Engineering conference. Subsequent posts will detail examples of exciting analytic engineering domain applications and aspects of the technical craft.
With this information, IT can craft an IT strategy that gives the company an edge over its competitors. If competitors are using advanced data analytics to gain deeper customer insights, IT would prioritize developing similar or better capabilities.
DEX best practices, metrics, and tools are missing Nearly seven in ten (69%) leadership-level employees call DEX an essential or high priority in Ivanti’s 2024 Digital Experience Report: A CIO Call to Action , up from 61% a year ago. Most IT organizations lack metrics for DEX.
Alex Circei is the CEO and co-founder of Waydev , a development analytics tool that measures engineering teams' performance. Start with DORA metrics. DORA metrics measure software delivery velocity and throughput by plugging into Git (commits and pull requests) and deployment data. Alex Circei. Contributor. Share on Twitter.
Specify metrics that align with key business objectives Every department has operating metrics that are key to increasing revenue, improving customer satisfaction, and delivering other strategic objectives. Below are five examples of where to start. Gen AI holds the potential to facilitate that.
Alex Circei Contributor Share on Twitter Alex Circei is the CEO and co-founder of Waydev , a development analytics tool that measures engineering teams' performance. They should embrace new, holistic metrics and learn how to respond to them. These are critical indicators, which essentially measure agility and quality.
Zoho has updated Zoho Analytics to add artificial intelligence to the product and enables customers create custom machine-learning models using its new Data Science and Machine Learning (DSML) Studio. The advances in Zoho Analytics 6.0 Auto Analysis enables AI-powered automated metrics, reports, and the generation of dashboards.
They reveal the strengths and weaknesses of a model, enable it to be compared with others and thus create the basis for informed decisions. One example is SQuAD (Stanford Question Answering Dataset), which provides text passages and associated questions to test whether a model can extract relevant information from the passages.
That’s one of the reasons Jonathan Cherki founded Contentsquare , a platform that allows businesses to track online customer behavior to inform digital strategies. Contentsquare remains focused on its original bread and butter, which is to say web and app analytics. billion in transactions daily. .” In the U.S.
For instance, CIOs in industries like financial services need to monitor how competitors leverage AI for fraud detection or offer personalized services to inform their IT strategies. These metrics might include operational cost savings, improved system reliability, or enhanced scalability.
“Once you get investors, the story doesn’t matter; it’s all about the metrics, the numbers and the performance,” Bamberger said. Track and capture: Getting started with attention metrics. ” Track and capture: Getting started with attention metrics.
Data-informed decision-making is a key attribute of the modern digital business. One potential solution to this challenge is to deploy self-service analytics, a type of business intelligence (BI) that enables business users to perform queries and generate reports on their own with little or no help from IT or data specialists.
Mainframes hold an enormous amount of critical and sensitive business data including transactional information, healthcare records, customer data, and inventory metrics. Without integrating mainframe data, it is likely that AI models and analytics initiatives will have blind spots.
Aligning IT operations with ESG metrics: CIOs need to ensure that technology systems are energy-efficient and contribute to reducing the company’s carbon footprint. CIOs must stay informed about emerging solutions that reduce the energy demands of AI and blockchain while maintaining their operational benefits.
Data masking involves replacing sensitive data with obfuscated or pseudonymized values, ensuring that unauthorized access does not compromise critical information. Unlike traditional masking methods, their solution ensures that the data remains usable for testing, analytics, and development without exposing the actual values.
CMOs are now at the forefront of crafting holistic customer experiences, leveraging data analytics to gain insights into consumer behavior, and developing strategies that drive engagement across multiple channels. Enhancing decision-making comes from combining insights from marketing analytics and digital data to make informed choices.
Now, a startup called DataRails , which has built a set of financial planning and analytics tools for those users, so that they can get more out of their numbers on Excel (or whatever spreadsheet app is being used, for that matter), is announcing some funding on the back of seeing strong take-up of its product. Image Credits: DataRails.
Recently, chief information officers, chief data officers, and other leaders got together to discuss how data analytics programs can help organizations achieve transformation, as well as how to measure that value contribution. This is when data analytics programs deliver their greatest value. Arguing with data?
Nearly 10 years ago, Bill James, a pioneer in sports analytics methodology, said if there’s one thing he wished more people understood about sabermetrics, pertaining to baseball, it’s that the data is not the point. Improving player safety in the NFL The NFL is leveraging AI and predictive analytics to improve player safety.
Alex Circei is CEO and co-founder of Waydev , a Git analytics tool that measures engineers' performance automatically. An appropriate goal here would be to track and divide their team’s responsibilities more efficiently, which can be tracked using the same metrics, or cross-training members of other teams to assist with their tasks.
Data scientists are analytical data experts who use data science to discover insights from massive amounts of structured and unstructured data to help shape or meet specific business needs and goals. Business: Data analysis of business data can inform decisions around efficiency, inventory, production errors, customer loyalty, and more.
Tableau pitched its unveiling of Tableau Pulse last year as the harbinger of a new era of proactive analytics. This feature provides users the ability to explore metrics with natural language. Metrics Bootstrapping. When a user does so, it triggers Tableau Pulse to generate and push insights to the user based on the metrics.
Furthermore, predictive analytics can forecast hiring needs based on business growth projections and market trends, allowing organizations to address talent gaps proactively. Information on employee benefits, such as healthcare, retirement plans, and work-life balance initiatives, can also be compelling.
Interestingly, the company judged to be the fastest-growing on the latest list, Plausible , is an “open startup” (all its metrics are published, including revenues) and states on its website that it is “not interested in raising funds or taking investment.
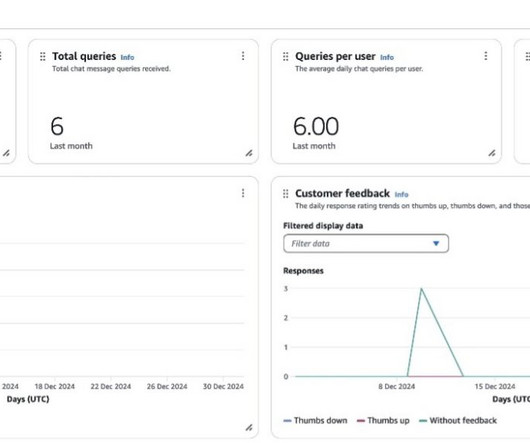
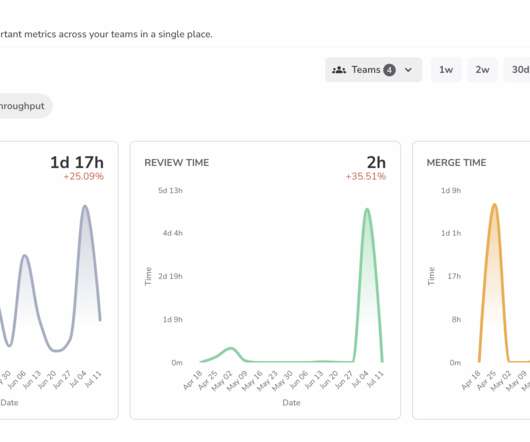
Amazon Q Business offers a unique opportunity to enhance workforce efficiency by providing AI-powered assistance that can significantly reduce the time spent searching for information, generating content, and completing routine tasks. Key metrics include Total queries and Total conversations , which give an overall picture of system usage.
. “Operational analytics” Fast-forward to April 2021, and the commercial MergeStat company was officially born, with DeVivo going on to lure Josue Lopez from cloud giant Equinix to serve as chief operating officer (COO), as well as official cofounder. But what are the kinds of use-cases that MergeStat might support?
Data analytics in recruitment plays a significant role since it provides insights and information to help make hiring decisions. Organizations may increase the efficiency and effectiveness of their recruiting activities by employing data analytics, resulting in hiring better-suited individuals. What is recruitment analytics?
In a world whereaccording to Gartner over 80% of enterprise data is unstructured, enterprises need a better way to extract meaningful information to fuel innovation. This is particularly valuable for industries handling large document volumes, where rapid access to specific information is crucial.
Its sales analysts face a daily challenge: they need to make data-driven decisions but are overwhelmed by the volume of available information. They have structured data such as sales transactions and revenue metrics stored in databases, alongside unstructured data such as customer reviews and marketing reports collected from various channels.
Insightly Analytics helps engineering teams stop problems before they happen, like slow release cycles, bottlenecks and uneven workload distribution that can lead to employee burnout. Then he moved on to a role as director of engineering at a markets informational resource website publisher that was later acquired by Bankrate.
This wealth of content provides an opportunity to streamline access to information in a compliant and responsible way. Principal wanted to use existing internal FAQs, documentation, and unstructured data and build an intelligent chatbot that could provide quick access to the right information for different roles.
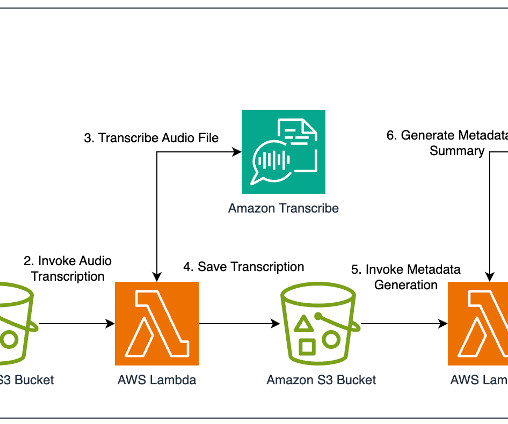
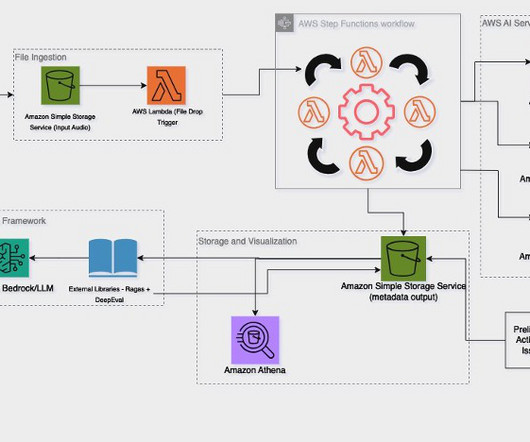
With a growing library of long-form video content, DPG Media recognizes the importance of efficiently managing and enhancing video metadata such as actor information, genre, summary of episodes, the mood of the video, and more. Word information lost (WIL) – This metric quantifies the amount of information lost due to transcription errors.
The best way to do so is to collect and use candidate experience metrics and insights. Let’s start with the basics and discuss how hiring metrics and insights can help create an awesome candidate experience. Candidate experience metrics: Which are the most relevant? #1
Recognize IT and business are inseparable IT and business strategies are now fully intertwined, observes Jay Upchurch, EVP and CIO at analytics vendor SAS. It delivers visibility to inform data-driven decisions to improve cost savings and risk management,” he notes. “It Here are 11 effective ways to reach that goal.
Therefore, it was valuable to provide Asure a post-call analytics pipeline capable of providing beneficial insights, thereby enhancing the overall customer support experience and driving business growth. The human-in-the-loop UI plus Ragas metrics proved effective to evaluate outputs of FMs used throughout the pipeline.
Taylor adds that functional CIOs tend to concentrate on business-as-usual facets of IT such as system and services reliability; cost reduction and improving efficiency; risk management/ensuring the security and reliability of IT systems; and ongoing support of existing technology and tracking daily metrics.
Power BI is Microsoft’s interactive data visualization and analytics tool for business intelligence (BI). With Power BI, you can pull data from almost any data source and create dashboards that track the metrics you care about the most. Power BI’s rich reports or dashboards can be embedded into reporting portals you already use.
And the Global AI Assessment (AIA) 2024 report from Kearney found that only 4% of the 1,000-plus executives it surveyed would qualify as leaders in AI and analytics. To counter such statistics, CIOs say they and their C-suite colleagues are devising more thoughtful strategies. As part of that, theyre asking tough questions about their plans.
According to a recent Fivetran survey , 82% of companies are making decisions based on stale information, 85% of which say is leading to incorrect decisions and lost revenue. “The industry at large is upon the next wave of technical hurdles for analytics based on how organizations want to derive value from data.
Observability refers to the ability to understand the internal state and behavior of a system by analyzing its outputs, logs, and metrics. Evaluation, on the other hand, involves assessing the quality and relevance of the generated outputs, enabling continual improvement.
Pitched as an “all-in-one information hub” for students, parents, teachers and admins, Schoolytics is an analytics dashboard (School + Analytics = Schoolytics, yeah?) The parent dashboard, which lets a parent/guardian see those metrics for each of the kids in their house.
That’s not necessarily the case, says Christina Janzer, SVP of research and analytics at Slack. Managers tend to incentivize activity metrics and measure inputs versus outputs,” she adds. The information volume piece is definitely one of the areas where productivity could go down,” says Woolley. “It
Recently, the news broke that Optimizely acquired Netspring, a warehouse-native analytics platform. Simplifying Omnichannel Analytics for Real Digital Impact Netspring is not just another analytics platform. It is focused on making warehouse-native analytics accessible to organizations of all sizes.
We organize all of the trending information in your field so you don't have to. Join 49,000+ users and stay up to date on the latest articles your peers are reading.
You know about us, now we want to get to know you!
Let's personalize your content
Let's get even more personalized
We recognize your account from another site in our network, please click 'Send Email' below to continue with verifying your account and setting a password.


Let's personalize your content