This site uses cookies to improve your experience. To help us insure we adhere to various privacy regulations, please select your country/region of residence. If you do not select a country, we will assume you are from the United States. Select your Cookie Settings or view our Privacy Policy and Terms of Use.
Cookie Settings
Cookies and similar technologies are used on this website for proper function of the website, for tracking performance analytics and for marketing purposes. We and some of our third-party providers may use cookie data for various purposes. Please review the cookie settings below and choose your preference.
Used for the proper function of the website
Used for monitoring website traffic and interactions
Cookie Settings
Cookies and similar technologies are used on this website for proper function of the website, for tracking performance analytics and for marketing purposes. We and some of our third-party providers may use cookie data for various purposes. Please review the cookie settings below and choose your preference.
Strictly Necessary: Used for the proper function of the website
Performance/Analytics: Used for monitoring website traffic and interactions
This includes spending on strengthening cybersecurity (35%), improving customer service (32%) and improving data analytics for real-time business intelligence and customer insight (30%). Related: 6 tips for making the most of a tight IT budgetBudgeting, IT Leadership, IT Strategy
For example, McKinsey suggests five metrics for digital CEOs , including the financial return on digital investments, the percentage of leaders’ incentives linked to digital, and the percentage of the annual tech budget spent on bold digital initiatives. As a result, outcome-based metrics should be your guide.
When Diminishing Returns Become Budget Busters For years enterprises scrambled to build applications in public cloud environments; there was legitimate business value in rapid innovation, deployment and scalability, as well as unfettered access to more geographical regions.
Power BI is Microsoft’s interactive data visualization and analytics tool for business intelligence (BI). You can also use Frontline’s Analytic Solver to turn Excel analytics models into custom Power BI visualizations without having to design the custom visual in JavaScript.
potential talent is becoming much more “efficient” in many firms, top talent is becoming simultaneously more expensive and more easily lost to competitors,” stresses professor of workforce analytics Mark Huselid in The science and practice of workforce analytics: Introduction to the HRM special issue. . What is people and HR analytics?
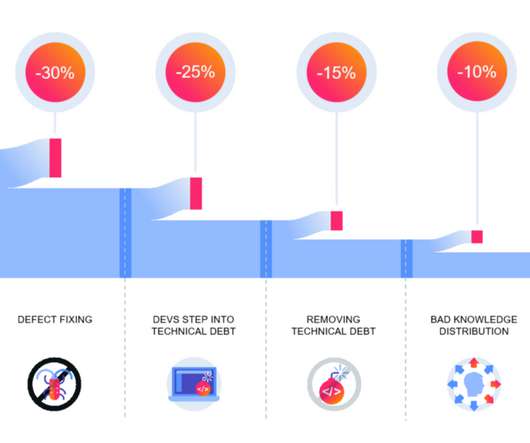
Analytics creates Extra Power for your Software Development Organization?—?Part The typical numbers you find in the real-world corporates are frightening high: Imagine you have a budget of 10 million Euros to spend on software development and only 2 million Euros can be used for value creation (see Image 1).
These anomalies are critical to identify not only because they can quickly lead to budget overruns but also indicate potential issues in resource management. To identify these anomalies, companies rely on specialized monitoring and analytics tools that compare real-time spending against historical data and predefined thresholds.
Analytics creates Extra Power for your Software Development Organization?—?Part They impact negatively on the budget but many of them can be remedied through software analytics. Image 1: What is using up your development budget? It’s worth noting that some form of analytics is required in order to be able to do so.
In this article, we’ll explain what procurement analytics is, highlight the main difficulties within the purchasing process, and look at how analytics can address them. What is procurement analytics and the opportunities it offers? Main components of procurement analytics. Procurement and its challenges.
Today, the biggest issue with metrics is not how to measure them – Google Analytics alone is a valuable tool for calculating and visualizing your success. It’s an effective KPI to use to monitor a company’s current health and it’s especially valuable in SaaS businesses working on a subscription basis. How to use MRR and ARPU.
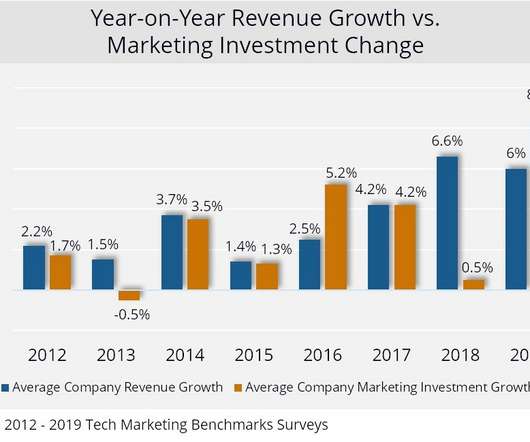
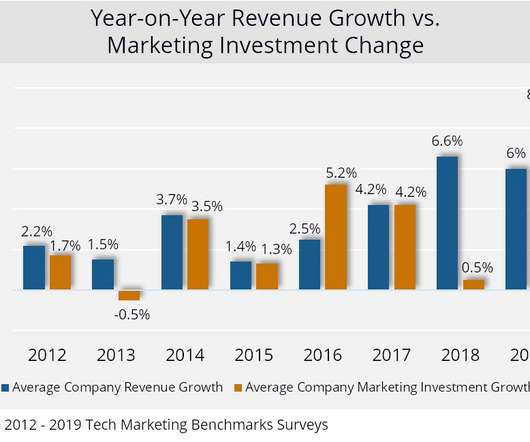
Key Finding: Marketing Gets a Budget Boost. Marketing budgets among the 54 technology companies surveyed increased by an average of 8.9% Tech marketing budgets have grown every year since 2014, but IDC finds that in 2019 marketers experienced one of the best growth years ever. of revenue.
Analisi dei dati, addestramento dei nuovi modelli di intelligenza artificiale , sviluppo software, ammodernamento dei sistemi legacy, partecipazione alla definizione del budget, dialogo con le funzioni di business, relazione con i fornitori: i compiti del CIO si moltiplicano ogni giorno di più.
We also investigate predicting ADR through machine learning and strategies to enhance this KPI. Unlike the other metrics, ADR focuses solely on revenue from actual room sales, making it a vital KPI of a hotel’s pricing strategy effectiveness. As one of the analytical pillars, ADR provides a clear view of revenue performance.
Key Finding: Marketing Gets a Budget Boost. Marketing budgets among the 54 technology companies surveyed increased by an average of 8.9% Tech marketing budgets have grown every year since 2014, but IDC finds that in 2019 marketers experienced one of the best growth years ever. of revenue.
What gives data meaning is analytics – which in turn can shape business operations, thereby giving organizations a clear competitive advantage. What’s needed is a self-service analytics platform with best-in-class metrics that transforms data into actionable business insights based on historical trends and predictive models.
Throughout the entire development stage, this person ensures that the project goes in line with the set budget and time frames. Estimate time, budget, and risks. Project Manager’s KPI – Tracking improvement over time. As for the assessment of a project manager, this is a great KPI to reveal their estimation skills.
Enter the Power BI Purchase Dashboard: a powerful analytics tool allowing organizations real-time insights into their procurement activities, supplier performance, spending habits, and more. Trend Analysis: Identifies spending trends over time, allowing businesses to forecast future expenditures and make informed budgeting decisions.
This makes these clouds a cost-effective option for startups and small companies, which can start their business with a small budget. It ensures seamless communication between the cloud and the user by providing real-time analytics for cloud computing. You can opt for these services and pay as per use.
Closely linked to Power BI, Power BI analytics is the most powerful and efficient tool that enables you to not only view data but also uncover trends, identify opportunities, and model your organization to become more effective and successful.
Delivery estimation is based on such critical parameters as population density, vehicle type, and capacity, predictive traffic analytics, etc. Logistics analytics. Applying Business Intelligence, the software can develop performance metrics and KPIs, and create computer models to predict supply chain issues.
What you spent much of your budget on 5, 10 or 15 years ago may not be relevant anymore. Data taken over several years has shown us that marketing budget increases are leading directly to profit increases in tech companies. The average marketing budget ratio is 2.2% No one understands this better than tech companies.
Moreover, technology and analytics have enabled professionals in all fields to process a tidal wave of data and present it in informational and easy-to-understand reports. IT reports help companies plan better budgets, prevent client churn and streamline processes by making informed business decisions. MSP benefits.
Data leakages in reporting and analytics activities. Some of the important KPI categories that have to be monitored are. Financial and reporting modules: supporting billing and analytics. Crane analytics dashboard in Navis N4. Terminal operators need to have full visibility into all facility activities.
Notably, every goal should have a clear KPI (Key Performance Indicators). KPIs work wonders when they are numerical. Also, selecting app development methods for your project is based on technical expertise, budget, app complexity and time to market. . So, ensure you plan and budget accordingly. The Parting Thought… .
They also have the capability to generate reports and analytics, which helps in decision-making across diverse platforms. They offer independent approvals, flow management, reminders, personalized alerts, and time-outs, with KPI dashboards and reports for tracking success.
Core Features of Power BI for Supply Chain Analytics From seamless data connectivity to intuitive visualization capabilities and seamless integration with other Microsoft products, Power BI emerges as a vital asset in optimizing supply chain operations. Here’s an in-depth look at three common types of supply chain dashboards: 1.
Using ML (machine learning), advanced conversational analytics, and NLP (natural language processing), AI in the banking industry has reshaped the customer journey. Analytics & Data Insights By processing huge volumes of data from customer interactions, conversational AI enables invaluable insights unavailable so far.
KPI-driven pricing. Starwood Hotels (is a part of Marriott since 2016) uses data analytics to match room prices with current demand. Source: Analytics for an Online Retailer: Demand Forecasting and Price Optimization. “Our software works with massive amounts of data, both internal and external. says Shartsis.
Analytics & Reports Search engine. KPI monitoring. Powerful analytics. The analytic reports are super robust. You’ll get access to thorough project reports and analytics. Budget management. Analytics and reports are quite robust. Features: Effective collaboration tools. Story mapping. Free trial.
KPI monitoring. Analytics so you can see your tasks progress. Also, resource analytics aren’t in-depth. With nTask, you don’t have to allocate budget for other tools since nTask does it all. Analytics and reports are available. The analytic reports are super robust. Features: Effective collaboration tools.
By breaking down these concepts, their purposes, and key characteristics, we’ll share insights to help you select the right solution based on your company size, goals, issues, and budget. The platform enables project data visualization in versatile formats, from Kanban boards and lists to charts that showcase workflow analytics.
The new analytics mandate is descriptive, predictive and prescriptive in context. When I meet with CIOs or executive sponsors, one of the first things I do is map out their analytics maturity curve. Descriptive analytics: Where most organizations begin and linger Descriptive analytics answers the question: What happened?
Per esempio, sono in corso i test sulluso della GenAI embedded in strumenti gi presenti in azienda, come Oracle Analytics, che permette di fare ricerca tra i dati e risponde ai prompt. Stiamo cercando casi duso per applicare lAI Generativa e trovare benefici a costi competitivi. QubicaAMF sta svolgendo diverse sperimentazioni con lAI.
Proactive Engagement: Utilizing predictive analytics, potential issues are identified before they arise and prompts CSRs to take proactive measures, thereby enhancing customer satisfaction. For transformation success, its imperative that financial services make KPI development and monitoring a priority.
We organize all of the trending information in your field so you don't have to. Join 49,000+ users and stay up to date on the latest articles your peers are reading.
You know about us, now we want to get to know you!
Let's personalize your content
Let's get even more personalized
We recognize your account from another site in our network, please click 'Send Email' below to continue with verifying your account and setting a password.


Let's personalize your content