This site uses cookies to improve your experience. To help us insure we adhere to various privacy regulations, please select your country/region of residence. If you do not select a country, we will assume you are from the United States. Select your Cookie Settings or view our Privacy Policy and Terms of Use.
Cookie Settings
Cookies and similar technologies are used on this website for proper function of the website, for tracking performance analytics and for marketing purposes. We and some of our third-party providers may use cookie data for various purposes. Please review the cookie settings below and choose your preference.
Used for the proper function of the website
Used for monitoring website traffic and interactions
Cookie Settings
Cookies and similar technologies are used on this website for proper function of the website, for tracking performance analytics and for marketing purposes. We and some of our third-party providers may use cookie data for various purposes. Please review the cookie settings below and choose your preference.
Strictly Necessary: Used for the proper function of the website
Performance/Analytics: Used for monitoring website traffic and interactions
Step 2: Understanding competitors Competitive analysis IT leaders must understand the competitive landscape to position their organization for success. Step 3: Current state analysis of IT IT landscape assessment IT leaders must evaluate their current technologies, processes, and capabilities.
Let’s see what engagement metrics gain the most significant interest from investors. Engagement over long periods at the end of a subscription There are many engagement metrics to look at. The obvious metric to review is how often your user opens the app toward the end of the period in question.
Deciding which metrics matter most for your startup. In this last part of my five-part series , we’ll cover how to determine which metrics matter for your startup. It’s very easy to get lost if you assume upper-funnel metrics are the most crucial for your startup. Don’t fall into this trap. They would be wrong.
Cohort analysis is a way of evaluating your business that involves grouping customers into “cohorts” and observing how they behave over time. Cohort analysis gives you a multivariable, forward-looking view of your business compared to more simple and static values like averages or totals.
This situation has become colloquially known as “analysis paralysis.” Overcoming it requires knowing exactly which metrics are the most important to track. In “The 10 KPIs Every Product Leader Needs to Know,” we break each of these metrics down, explain why they matter so much, and show you how to start tracking them.
Gen AI allows organizations to unlock deeper insights and act on them with unprecedented speed by automating the collection and analysis of user data. Felix AI adds velocity to our analysis processes…giving us more time to focus on tasks that matter and listen better to our customers” – Gabriel Polo, Head of Online Platform, Air Europa.
There are two main approaches: Reference-based metrics: These metrics compare the generated response of a model with an ideal reference text. Reference-free metrics: These metrics evaluate the quality of a generated text independently of a reference. This approach enables new possibilities that go beyond classic metrics.
Change management is a specialized discipline, just like business analysis, user experience development, or business analysis. Include performance metrics, KPIs [and] team recognition that promotes the behaviors and adoption metrics you seek. Bilow advises incorporating reinforcement and insight mechanisms.
It captures metrics, logs, and traces to help identify performance bottlenecks, detect failures, and forecast resource needs. Comparative analysis of Azure management platforms Azure is one of the most widely adopted cloud platforms. Datadog provides real-time performance metrics, logs, and security insights across Azure environments.
Among these signals, OpenTelemetry metrics are crucial in helping engineers understand their systems. In this blog, well explore OpenTelemetry metrics, how they work, and how to use them effectively to ensure your systems and applications run smoothly. What are OpenTelemetry metrics?
When you reframe the conversation this way, technical debt becomes a strategic business issue that directly impacts the value metrics the board cares about most. Our analysis found a distinct relationship between a company’s digital core maturity and technical debt remediation.
4 SaaS engagement metrics that attract investors Ask Sophie: How many employment green cards are available each year? ” In this detailed market analysis, Lam studies the differences between decentralized and centralized finance systems with an eye on the different ways risk manifests in each environment.
Establish clearcut metrics for application usefulness and measure them over time The 80/20 rule i.e., 80% of applications developed are seldom or never used, and 20% are useful still applies. An analysis of requests can identify application function areas that are difficult for employees to use or understand.
By deploying AI-powered code analysis, we systematically identified deteriorating modules exhibiting code smells, duplication patterns, excessive dependencies, and architectural brittleness enabling precise prioritization of refactoring efforts. Manual remediation would have been prohibitively resource-intensive.
DataJunction: Unifying Experimentation and Analytics Yian Shang , AnhLe At Netflix, like in many organizations, creating and using metrics is often more complex than it should be. DJ acts as a central store where metric definitions can live and evolve. As an example, imagine an analyst wanting to create a Total Streaming Hours metric.
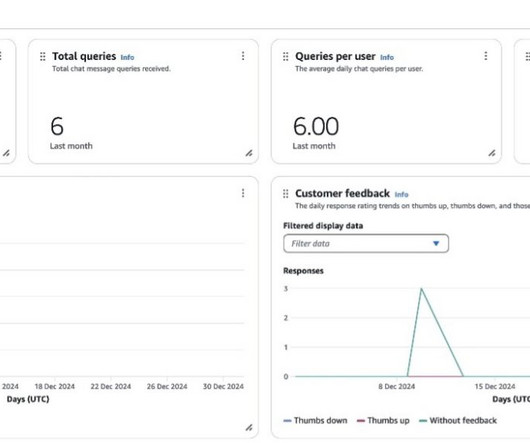
By monitoring utilization metrics, organizations can quantify the actual productivity gains achieved with Amazon Q Business. Tracking metrics such as time saved and number of queries resolved can provide tangible evidence of the services impact on overall workplace productivity.
MaestroQA augments call center operations by empowering the quality assurance (QA) process and customer feedback analysis to increase customer satisfaction and drive operational efficiencies. They assist with operations such as QA reporting, coaching, workflow automations, and root cause analysis.
The process involves the collection and analysis of extensive documentation, including self-evaluation reports (SERs), supporting evidence, and various media formats from the institutions being reviewed. You can process and analyze the models response within your function, extracting the compliance score, relevant analysis, and evidence.
Observability refers to the ability to understand the internal state and behavior of a system by analyzing its outputs, logs, and metrics. This enables easier analysis and processing of specific data subsets. Use feedback variables – Configure feedback_variables=True when initializing BedrockLogs to generate run_id and observation_id.
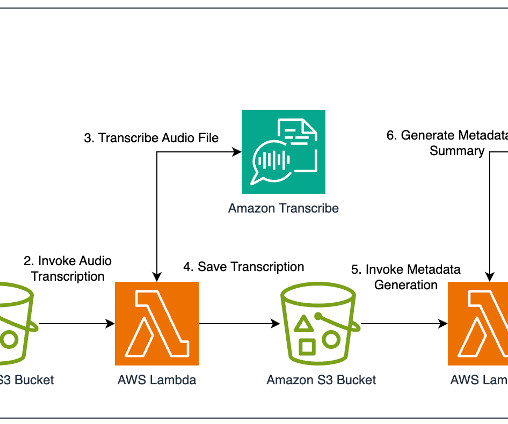
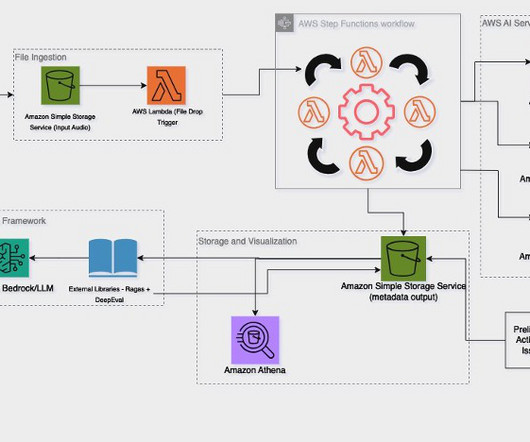
Video data analysis with AI wasn’t required for generating detailed, accurate, and high-quality metadata. Word information lost (WIL) – This metric quantifies the amount of information lost due to transcription errors. Hits – This metric counts the number of correctly transcribed words, giving a straightforward measure of accuracy.
Although automated metrics are fast and cost-effective, they can only evaluate the correctness of an AI response, without capturing other evaluation dimensions or providing explanations of why an answer is problematic. Human evaluation, although thorough, is time-consuming and expensive at scale.
These KPIs may vary depending on the nature and goals of the organization but could encompass metrics such as financial performance, strategic alignment, innovation, and stakeholder management. In summary: Our recommendations are based on a thorough analysis of the evaluation results, ensuring that they are grounded in data and evidence.
Tools like Pulse, Experiments+ and AutoTune allow for hundreds of experiments every week, while business metrics guide product teams to build and ship the right products to their customers. In addition, the company has automated analysis where other products require manual set up and analysis.
But because of the infrastructure, employees spent hours on manual data analysis and spreadsheet jockeying. We’re doing KPI visualization and trend analysis, and highlighting variances over time. Early on, we ground through creating our first data catalog, building clearer definitions of our target attributes and metrics.
By integrating measurable metrics with qualitative insights, these evaluations become a key driver of organizational transformationone that identifies pivotal leadership qualities, including agility, resilience, and adaptability. A consistent evaluation framework also fosters organizational resilience.
fetchData() } } Implementing SonarQube SonarQube is a powerful tool for code quality and security analysis. Run SonarQube Analysis: Execute the SonarQube analysis using the SonarQube Scanner. Analyze the Results: Once the analysis is complete, you can view the results on the SonarQube dashboard.
This complexity hinders quick, accurate data analysis and informed decision-making during critical incidents. New Relic AI initiates a deep dive analysis of monitoring data since the checkout service problems began. New Relic AI conducts a comprehensive analysis of the checkout service.
In this short article, I’ll discuss when to start measuring diminishing returns and how to use a simple regression analysis to find optimal spending levels. A spreadsheet with those metrics laid out on a weekly basis will help you identify large upticks in costs, which can then guide your future budget allocations.
This means Zoom customers, Zoom One Pro Business and Business Plus users will have free access to Read’s premium features, like real-time and advanced meeting metrics, for 12 months. The app is also compatible with other video conferencing platform such as Google Meet, Microsoft Teams and Webex.
Led by Pacetti, the company was able to reduce many variables in a complex system, like online sales and payments, data analysis, and cybersecurity. “We Tableau is also made available to internal users of the Messaggerie Italiane group, as well as external customers to conduct data analysis and combine them with data from other sources.
Use cases for Amazon Bedrock Data Automation Key use cases such as intelligent document processing , media asset analysis and monetization , speech analytics , search and discovery, and agent-driven operations highlight how Amazon Bedrock Data Automation enhances innovation, efficiency, and data-driven decision-making across industries.
Market Analysis Accelerate and reduce the time to perform research with GenAI, classifying and evaluating trends across industries. Competitive Analysis Conduct competitive and comparative analysis to uncover strategic opportunities, identify gaps, and inform product positioning for long-term success.
When company co-founder and CEO Thomas Li worked as a hedge fund analyst, he often performed repetitive data extraction in order to gather insights for analysis and forecasts. This was a big enough problem for one company to support all of the data analysis and forecasting without having to manually convert the data,” Li told TechCrunch.
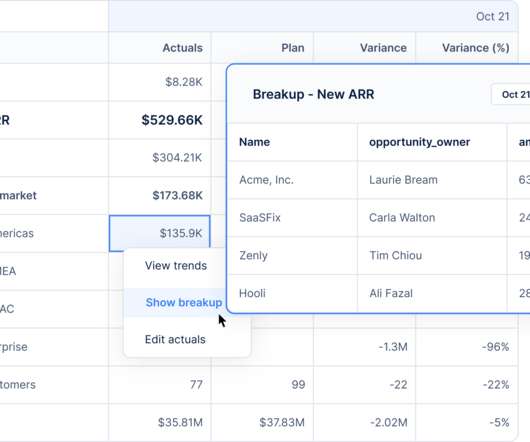
It integrates with 200 business tools, including Salesforce, Netsuite, Quickbooks, Workday and Looker, and delivers a “system of metrics” in simple formulas to help companies create financial models and visualizations. Drivetrain’s software showing revenue and customer buildup report with line items for analysis and insights.
Get your free copy of Charity’s Cost Crisis in Metrics Tooling whitepaper. Metrics-heavy shops are used to blaming custom metrics for their cost spikes, and for good reason. If you use a lot of custom metrics, switching to the 2.0 Every multiple pillars platform can handle your metrics, logs, traces, errors, etc.,
This fully managed service provides access to cutting-edge foundation models (FMs) from leading AI providers, enabling the seamless integration of state-of-the-art language models tailored for text analysis tasks. The human-in-the-loop UI plus Ragas metrics proved effective to evaluate outputs of FMs used throughout the pipeline.
According to Russ Heddleston, who founded DocSend before it was acquired by Dropbox, lone wolves tend to fare better with investors: His analysis found that one person can raise an average of $3.22 How to evolve your DTC startup’s data strategy and identify critical metrics. Senior Editor, TechCrunch+. yourprotagonist.
To optimize for growth, study your down-funnel metrics. In other words, it takes countless tests and lots of analysis to determine the winners from the losers. Jonathan Martinez is a former YouTuber, UC Berkeley alum and growth marketing nerd who's helped scale Uber, Postmates, Chime and various startups. Why growth activation matters.
According to the study, IT departments today primarily use technical and IT-related metrics. Therefore, in practice, only a few metrics suitable for both sides would be found, and the result is the IT value proposition is often unseen. That is legitimate, but in this way, there’s no direct connection to the business.
Image Credits: Smalls Solid metrics [Slide 9] A lot of the numbers are redacted, but there’s still a lot to learn here. Tracking CAC, profit per box, LTV, AOV and ARR are the key metrics you’d expect from any subscription business, and in this case, the business is experiencing extreme growth. for success.
However, RAG has had its share of challenges, especially when it comes to using it for numerical analysis. In this post, we explore how Amazon Bedrock Knowledge Bases address the use case of numerical analysis across a number of documents. This is the case when you have information embedded in complex nested tables.
We also provide insights on how to achieve optimal results for different dataset sizes and use cases, backed by experimental data and performance metrics. The evaluation metric is the F1 score that measures the word-to-word matching of the extracted content between the generated output and the ground truth answer.
Non-routine cognitive jobs that require complex problem-solving, strategic thinking, or advanced technical skills that can be supported by gen AI in the form of data-driven insights, pattern recognition, or predictive analysis. These metrics include well-being, job satisfaction, personal growth, and skills development.
His advice spanned hiring, structure and analysis, with plenty of recommendations for where growth teams should be focusing their attention and resources. Some companies will goal growth teams purely on acquisition, others will deploy them against retention or other metrics. How to define growth.
We organize all of the trending information in your field so you don't have to. Join 49,000+ users and stay up to date on the latest articles your peers are reading.
You know about us, now we want to get to know you!
Let's personalize your content
Let's get even more personalized
We recognize your account from another site in our network, please click 'Send Email' below to continue with verifying your account and setting a password.


Let's personalize your content