This site uses cookies to improve your experience. To help us insure we adhere to various privacy regulations, please select your country/region of residence. If you do not select a country, we will assume you are from the United States. Select your Cookie Settings or view our Privacy Policy and Terms of Use.
Cookie Settings
Cookies and similar technologies are used on this website for proper function of the website, for tracking performance analytics and for marketing purposes. We and some of our third-party providers may use cookie data for various purposes. Please review the cookie settings below and choose your preference.
Used for the proper function of the website
Used for monitoring website traffic and interactions
Cookie Settings
Cookies and similar technologies are used on this website for proper function of the website, for tracking performance analytics and for marketing purposes. We and some of our third-party providers may use cookie data for various purposes. Please review the cookie settings below and choose your preference.
Strictly Necessary: Used for the proper function of the website
Performance/Analytics: Used for monitoring website traffic and interactions
Key performance indicator, or KPI, […]. The post 5 Ways KPIAnalysis Helps DevOps appeared first on DevOps.com. However, variety and veracity often determine success or failure, and they tend to sneak up on teams who haven’t fully considered them.
This includes spending on strengthening cybersecurity (35%), improving customer service (32%) and improving data analytics for real-time businessintelligence and customer insight (30%).
Demand forecasting is the analysis of information about past demand across all the customer segments. To achieve these goals, a revenue manager has to perform the following tasks: Market analysis and segmentation. Competitor analysis. Customer behavior analysis. Historical and current data analysis. KPI tracking.
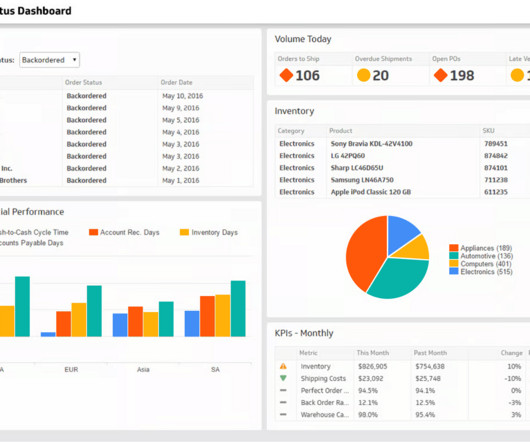
From supplier performance analysis to purchase order tracking, spend analysis, inventory management, and beyond, we will delve into the various functionalities of these Power BI Dashboards and demonstrate how it can help organizations like yours to drive business success through data-driven procurement management.
In the digital-first, customer-centric world we live in today, managers and business owners must deal with information overload. That is the reason why they are always looking for ways to derive greater intelligence, control, and understanding from their data. The Main Benefits of BusinessIntelligence Software.
The process of creating a Power BI executive dashboard is like peeling the forbidden fruit of facts that can transform your business process and give a fuller view when making decisions for your organization. It includes KPIs such as gross profit margin, net profit margin, return on investment (ROI), and financial ratios.
So, the aim of this article is to describe the main KPIs typically adopted by hotels to support their businessanalysis. Despite its simplicity, the occupancy rate is an important KPI that shows how full your hotel is. Same as the RevPAR, this KPI doesn’t consider any input costs, so it can’t show the ultimate profit.
We specialize in understanding the core of every challenge and creating a custom businessintelligence strategy to fit unique needs. Our Power BI developers delved into the root problems faced and identified the specific data visualization requirements to enhance businessintelligence. The result by Power BI experts?
Although developing custom KPI’s, metrics, reports and dashboards from scratch is fully supported in FA, what we see more often is our clients starting with an out-of-the-box (OOTB) KPI or report and modifying it to reflect the unique aspects of their company (which is, of course, fully supported).
People analytics is the analysis of employee-related data using tools and metrics. Dashboard with key metrics on recruiting, workforce composition, diversity, wellbeing, business impact, and learning. Forecasting future outcomes, events or values based on the analysis of current and historical data is done with predictive analytics.
These services use data analysis and asset monitoring tools to predict equipment failures. These services comprise building businessintelligence and performance management solutions that provide manufacturers with robust data analytics and reporting tools for KPI monitoring and trend identification.
Read on to find out what occupancy prediction is, why it’s so important for the hospitality industry, and what we learned from our experience building an occupancy rate prediction module for Key Data Dashboard — a US-based businessintelligence company that provides performance data insights for small and medium-sized vacation rentals.
Price analysis dashboard by Sievo with opportunities overview. E-invoicing and analytical tools also apply the aforementioned ML techniques for intelligent document processing such as OCR, RPA, and NLP to manage and analyze invoices. Cost analysis. This KPI also helps categorize your suppliers. Inventory-related KPIs.
While technologies such as AI and tools like advanced analytics have matured over time to help businesses leverage these massive data sets, organizations are not utilizing these to create a competitive advantage. This blog is a guide to how your company can become a data driven organization.
Top inventory management KPIs We can’t describe all the inventory KPIs that exist out there, so we’ll focus on the most popular and actionable ones. We’ll also suggest a few tips on how to approach inventory-related businessintelligence. So let’s dive in. How to approach it? Important to understand. How to approach it?
Some of the important KPI categories that have to be monitored are. So, no reporting and holistic data analysis is possible without having all the data in one integrated system. Financial, businessintelligence, and general ledger systems. Data leakages in reporting and analytics activities. How to choose a TOS?
KPI monitoring and analytics. In these sensors, a wide range of technologies is used, from infrared beams to lasers to acoustic analysis. delayed cars, switching failures, cars ordered but not placed) in case any disputes arise, as well as for future analysis. Managing lease contracts. Some of the industry-popular sensors are.
Data Transformation and Modeling: With Power BI, users can perform advanced data transformation and modeling operations to prepare raw supply chain data for analysis. KPI Dashboard Units Per Transaction Metric: This metric calculates the average number of units sold per transaction.
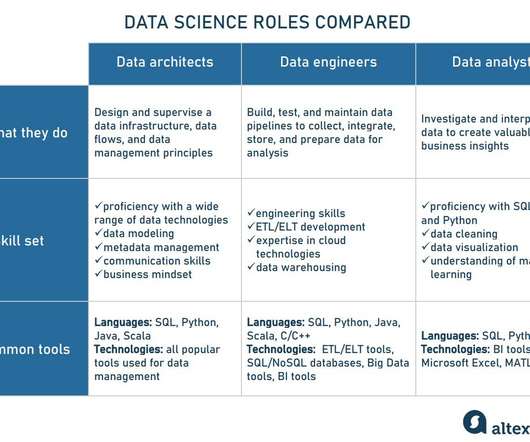
machine learning and deep learning models; and businessintelligence tools. The former uses data to generate insights and help businesses make better decisions, while the latter designs data frameworks, flows, standards, and policies that facilitate effective data analysis.
We organize all of the trending information in your field so you don't have to. Join 49,000+ users and stay up to date on the latest articles your peers are reading.
You know about us, now we want to get to know you!
Let's personalize your content
Let's get even more personalized
We recognize your account from another site in our network, please click 'Send Email' below to continue with verifying your account and setting a password.


Let's personalize your content